Comparison
This guide explains how to use the Comparison feature in Family Navigator to compare different groups and analyze their performance across various categories and subcategories.
Overview
The Comparison page allows you to select multiple comparison groups and visualize their performance data side-by-side using interactive bar charts. You can compare existing groups or create custom dynamic groups based on specific criteria.
Accessing Comparison
- Log in to the Family Navigator application.
- Navigate to the "Comparison" section from the main menu.
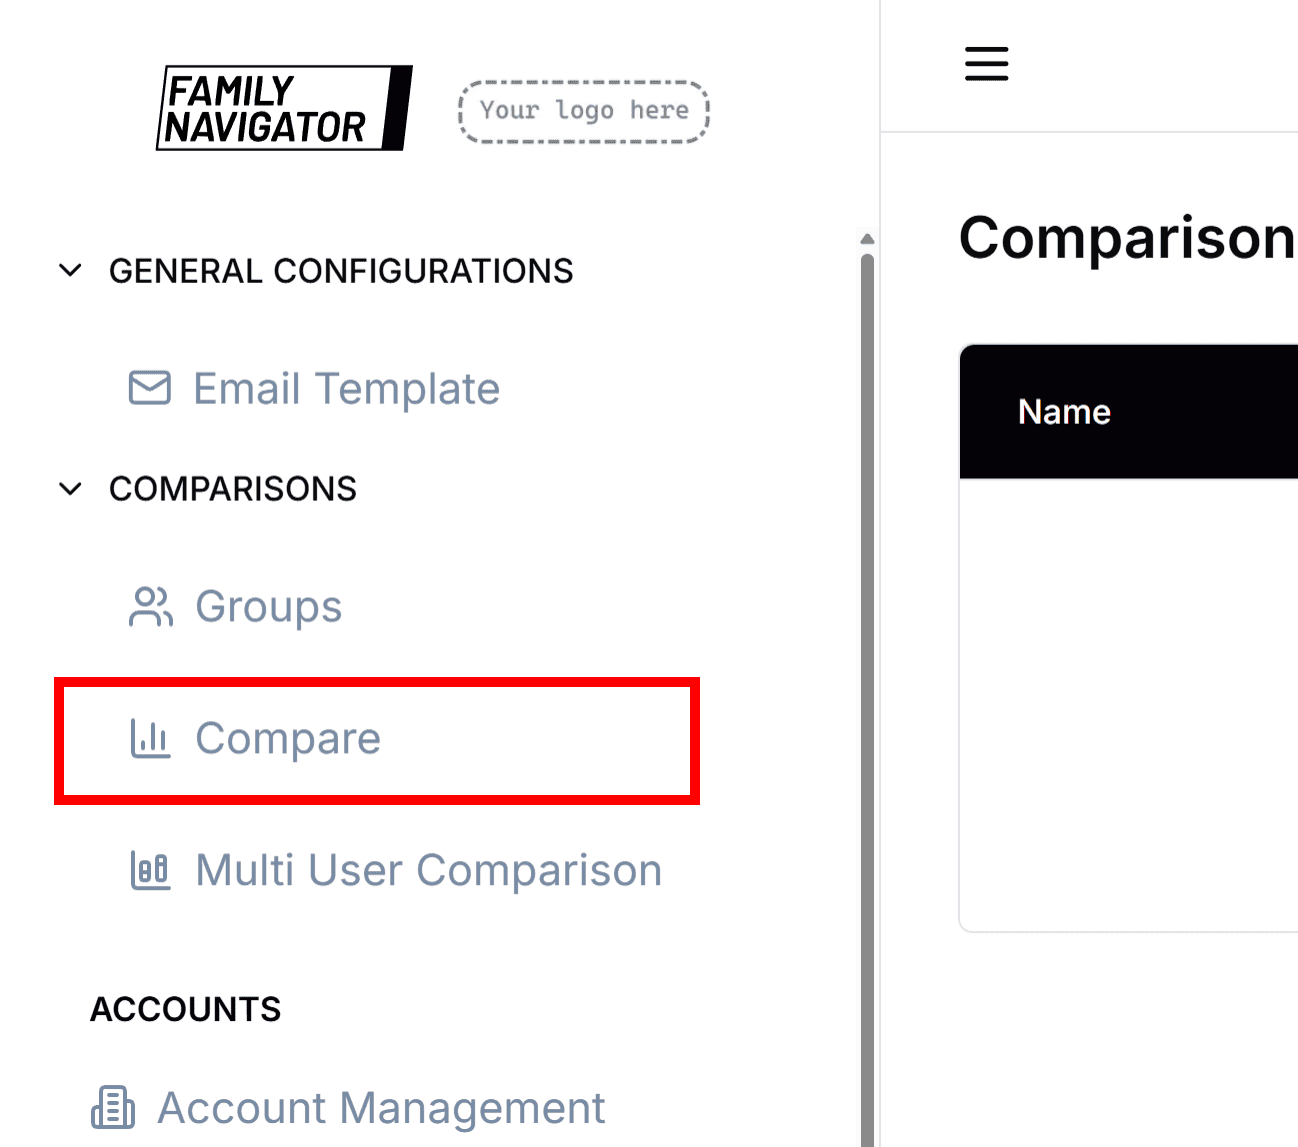
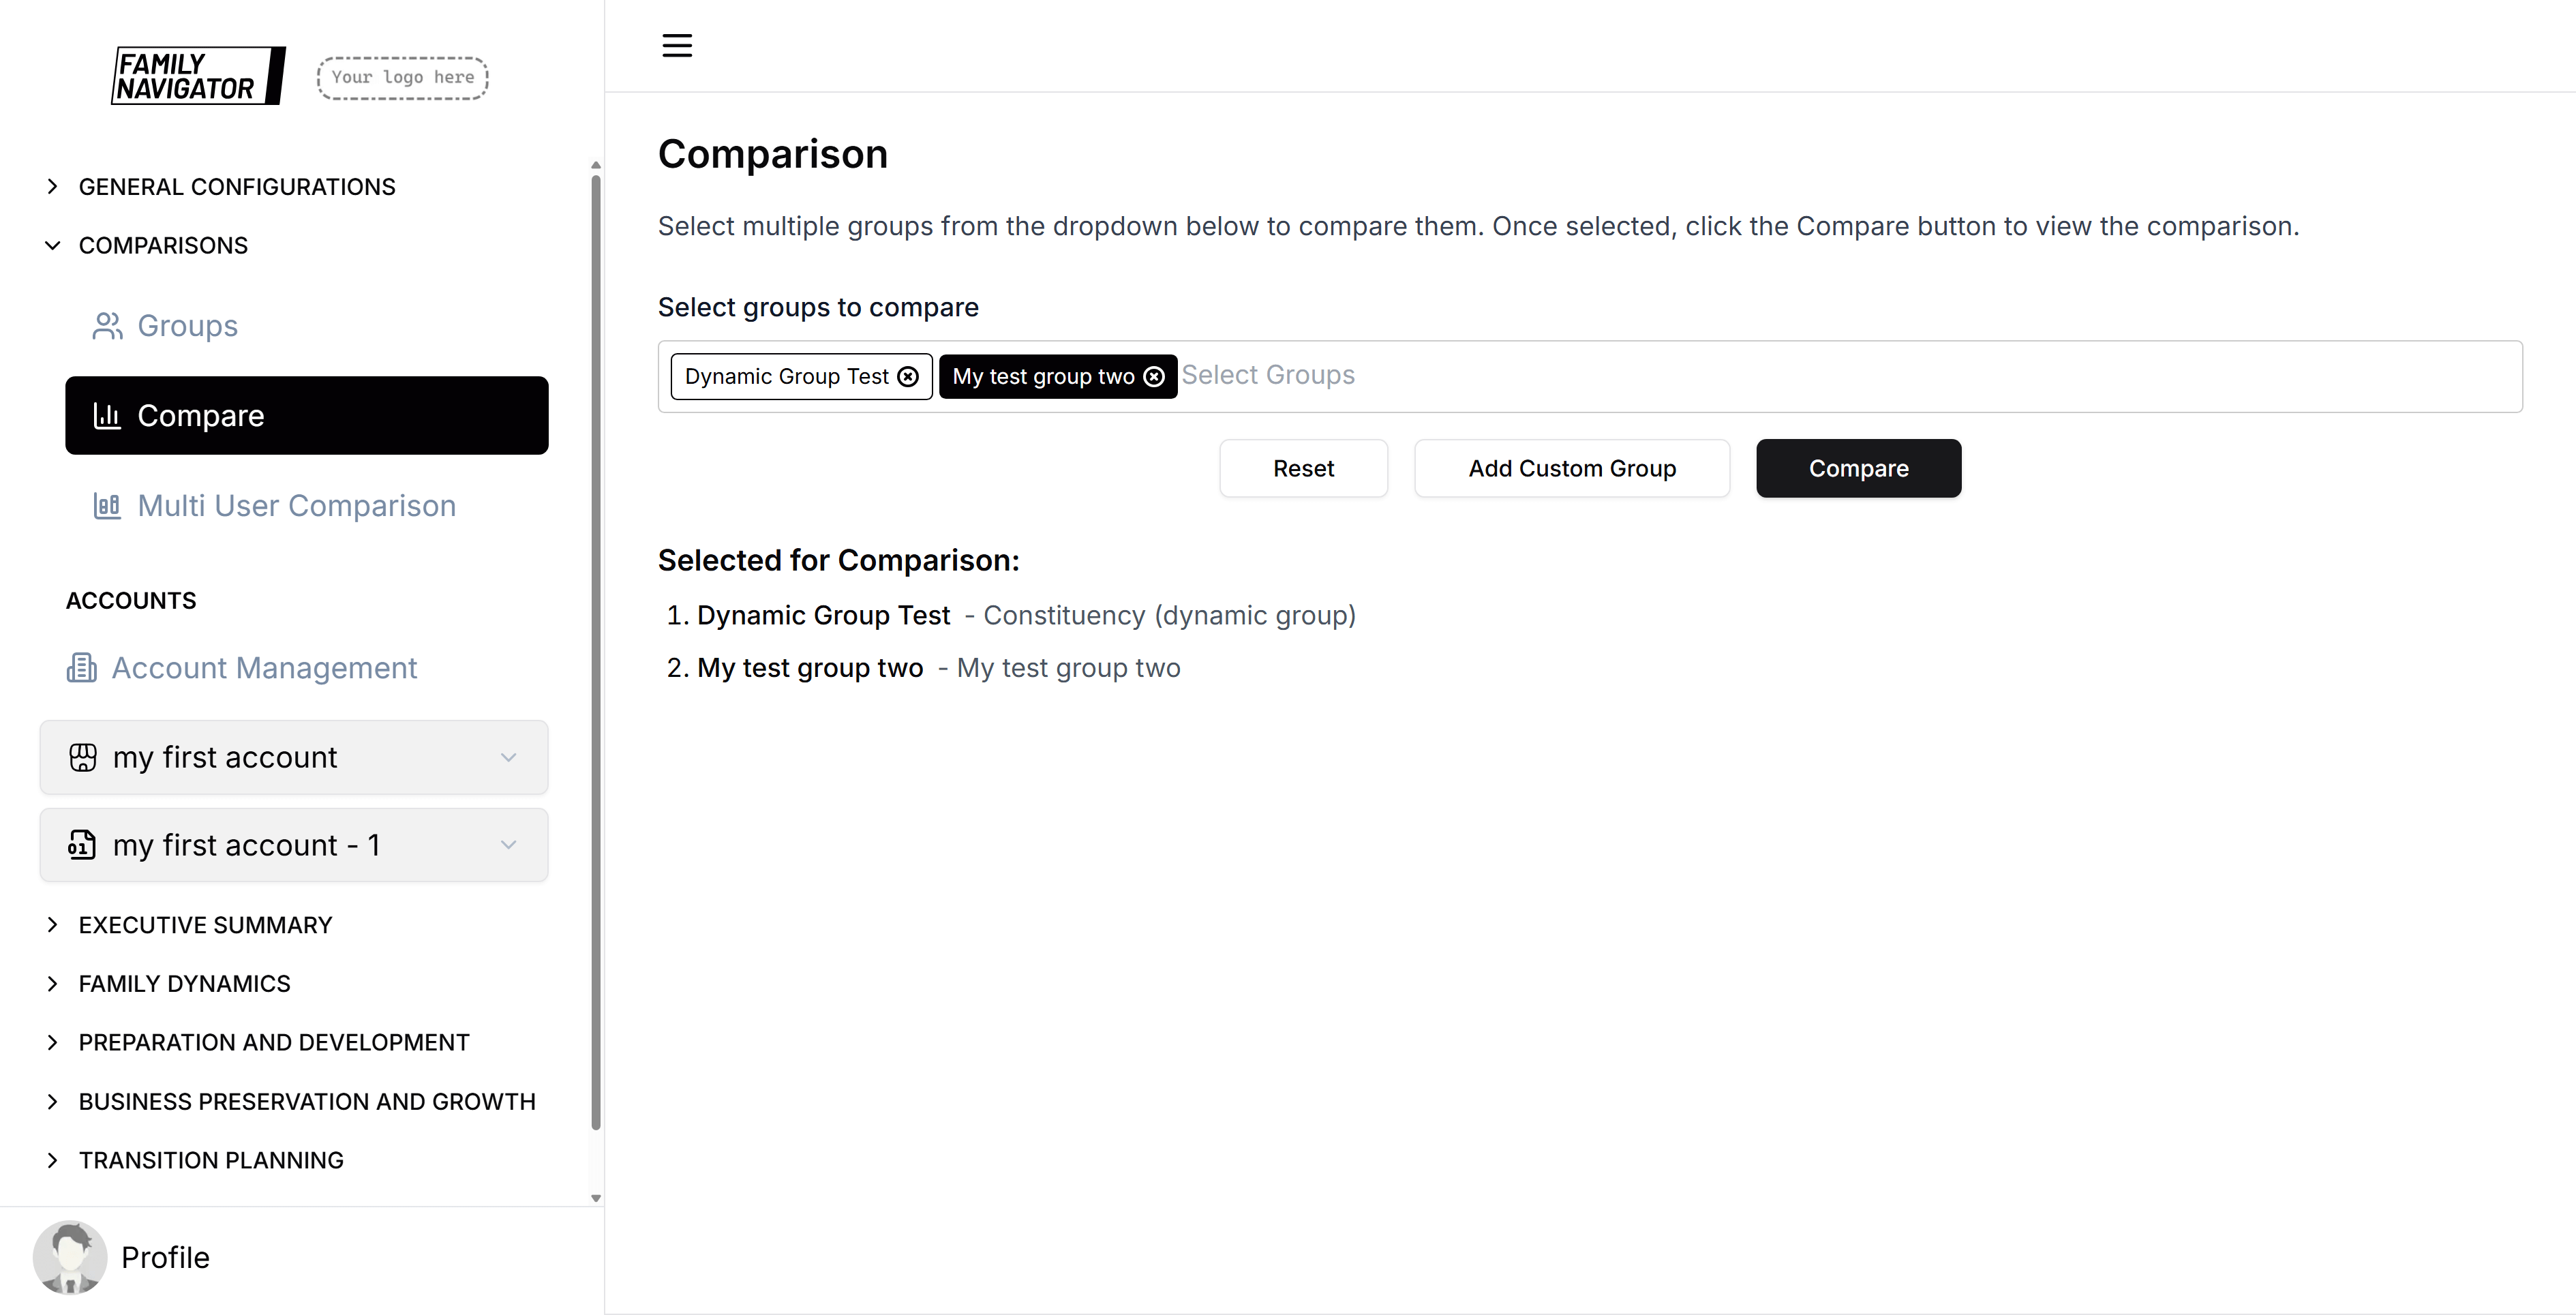
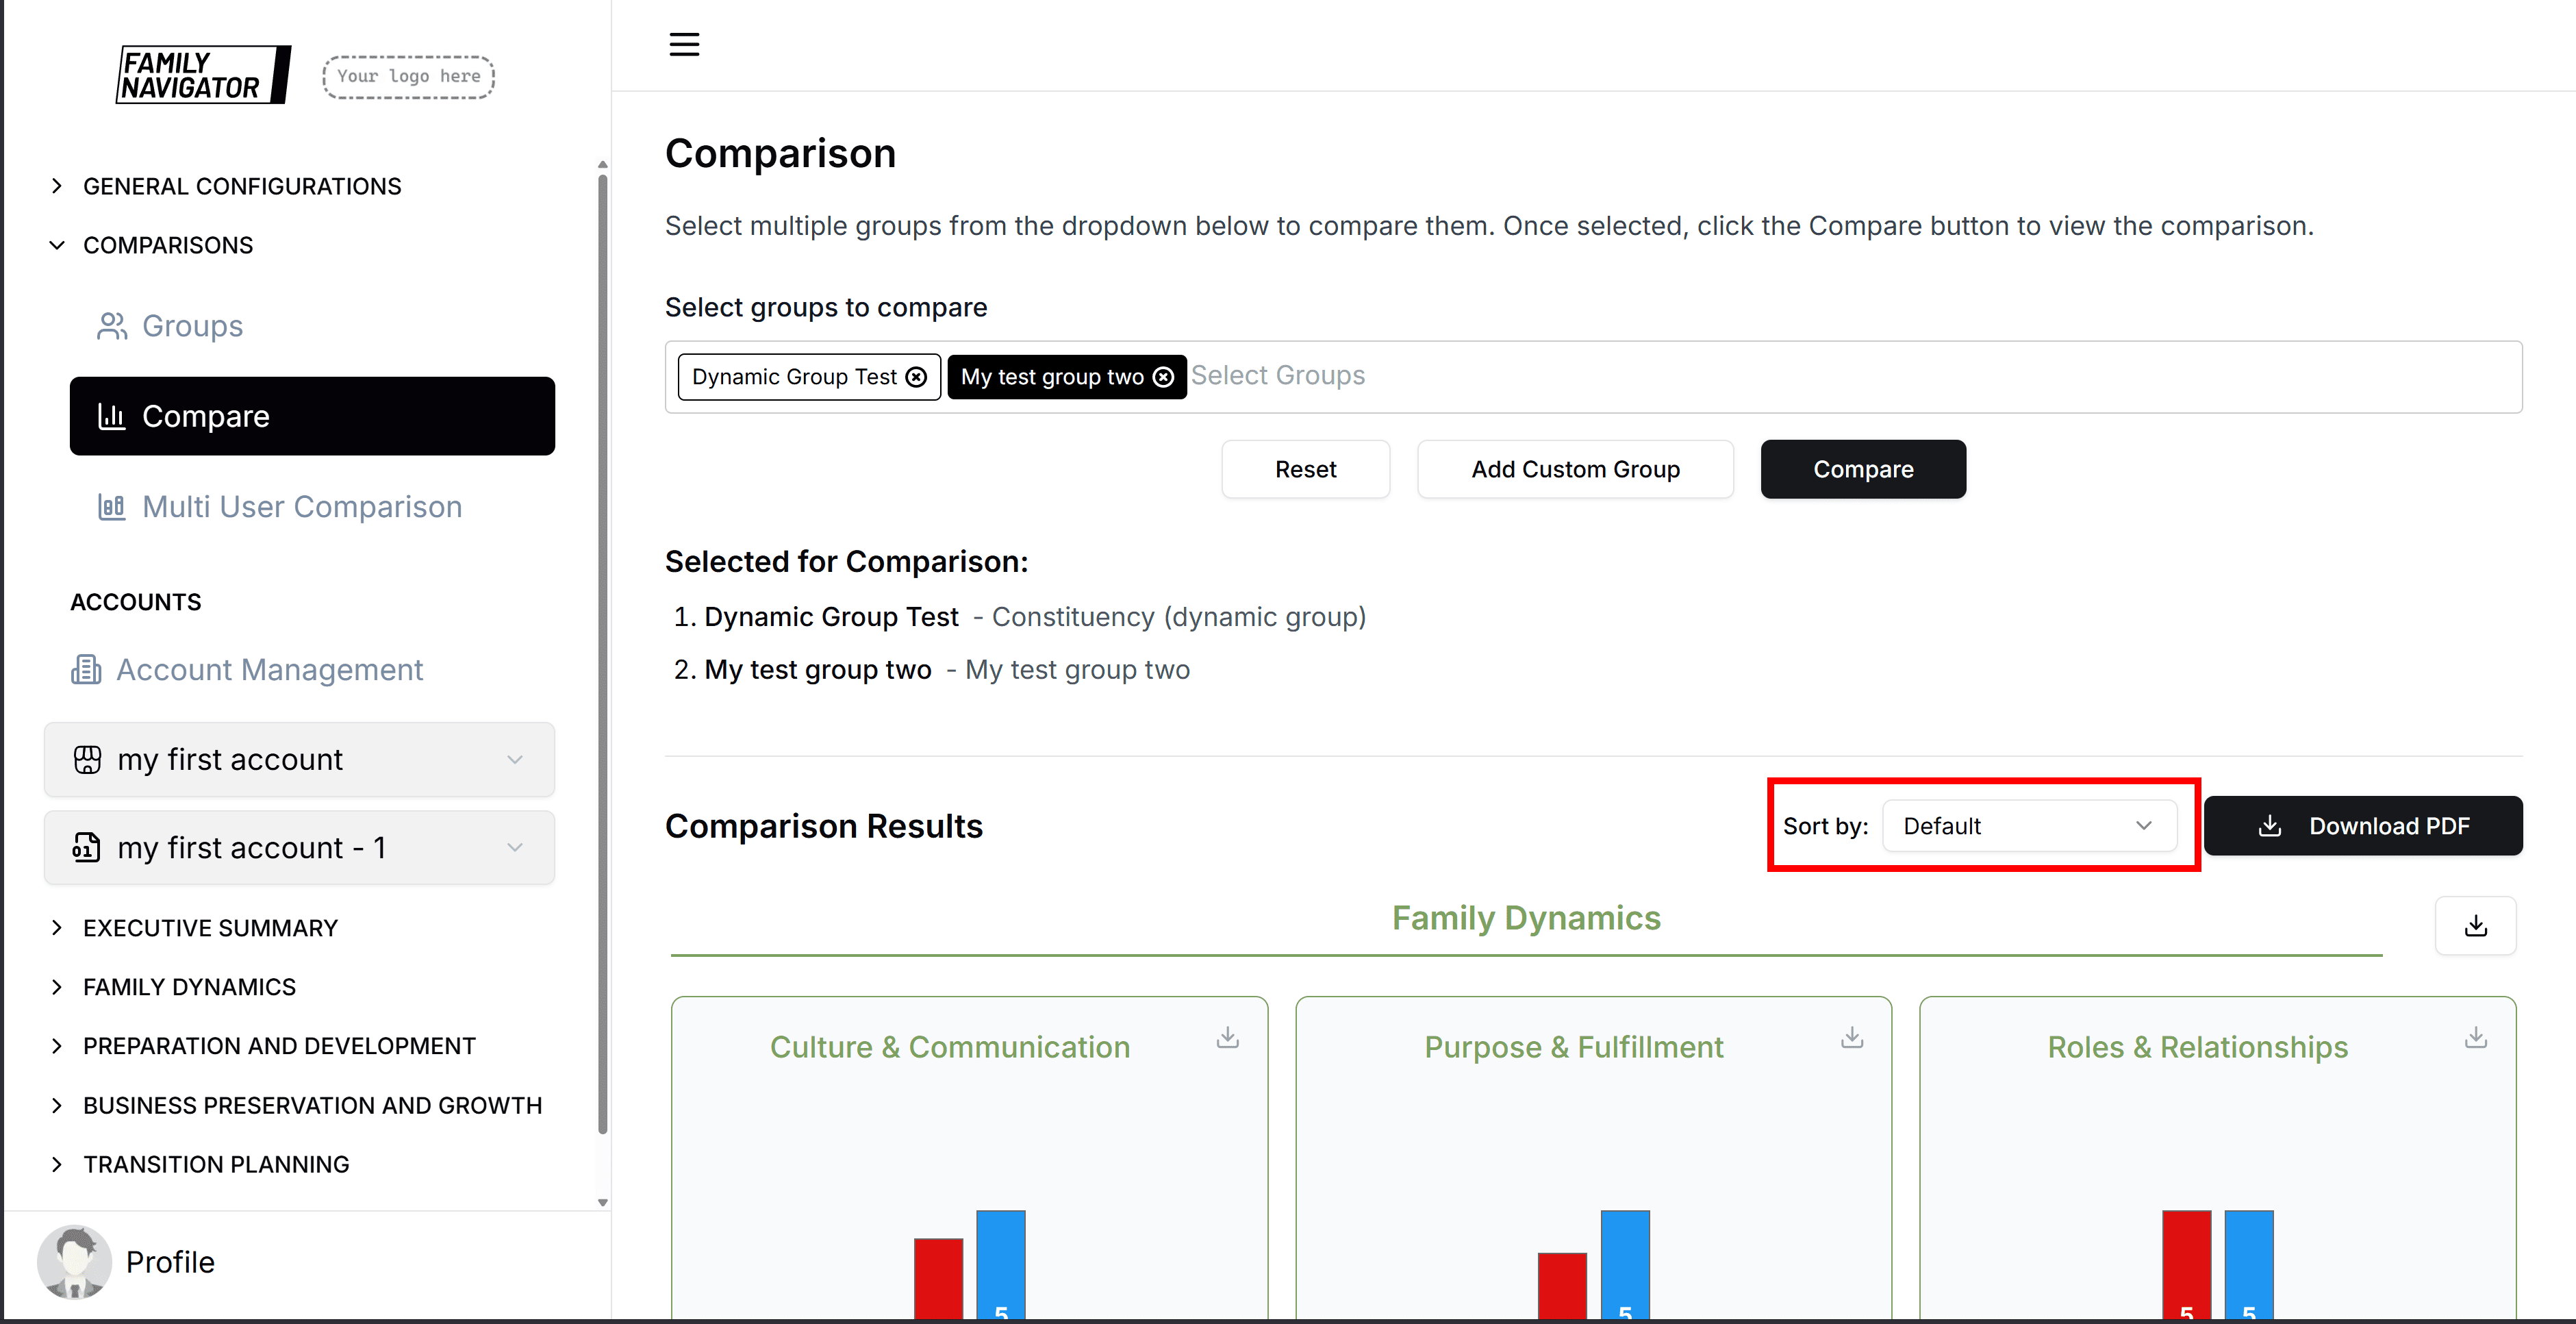
Selecting Groups for Comparison
Step 1: Choose Existing Groups
Use the multi-select dropdown to choose from existing comparison groups.

- Click on the dropdown to see available groups
- Select multiple groups by checking the boxes
- Groups will appear as chips below the dropdown

Step 2: Compare Selected Groups
Once you have selected your groups, click the "Compare" button.
The system will process the data and display comparison results.
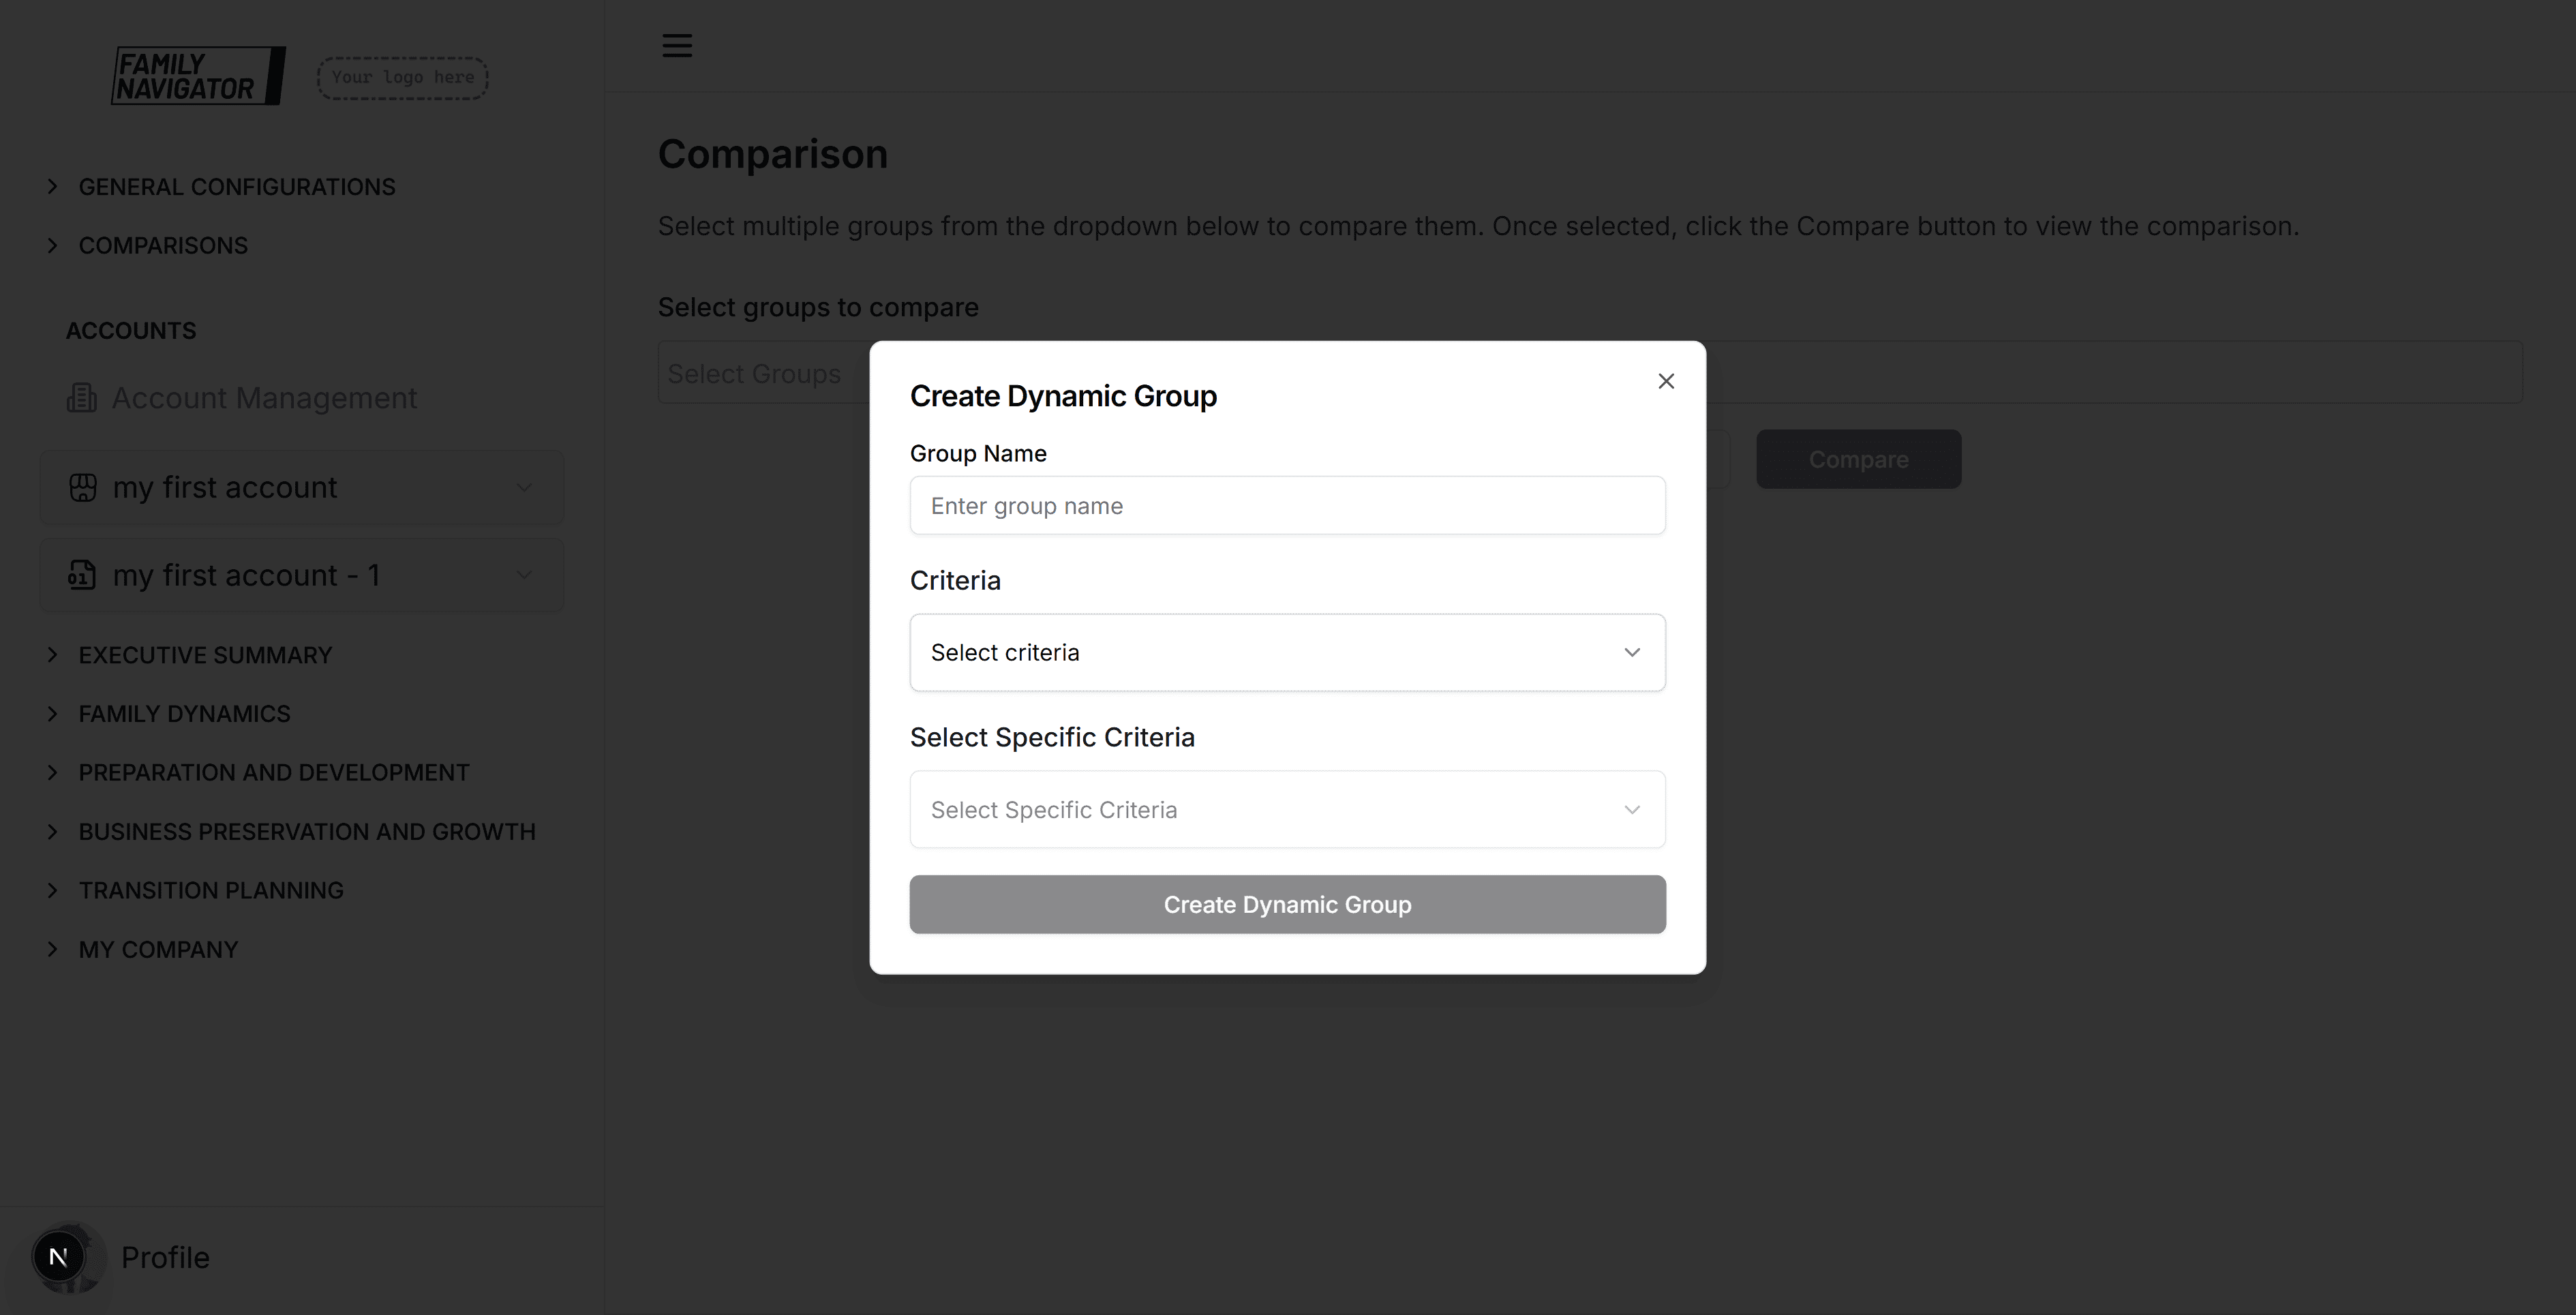
Create Custom Dynamic Groups
If you need to create a custom group on-the-fly:
- Click the "Add Custom Group" button
- Fill in the group details in the modal

Custom Group Creation
Group Name: Enter a descriptive name for your custom group.
Criteria Selection: Choose the criteria for grouping users:
- Industry: Group by industry type
- Employee Size: Group by company size
- Generation: Group by enterprise generation
- Family Generation: Group by family generation
- Revenue: Group by revenue range
- Account: Group by specific account
- Constituency: Group by constituency (requires account selection first)
Specific Criteria: Select the specific value for your chosen criteria.
For Constituency criteria, you'll need to:
- First select an Account
- Then select the specific Constituency
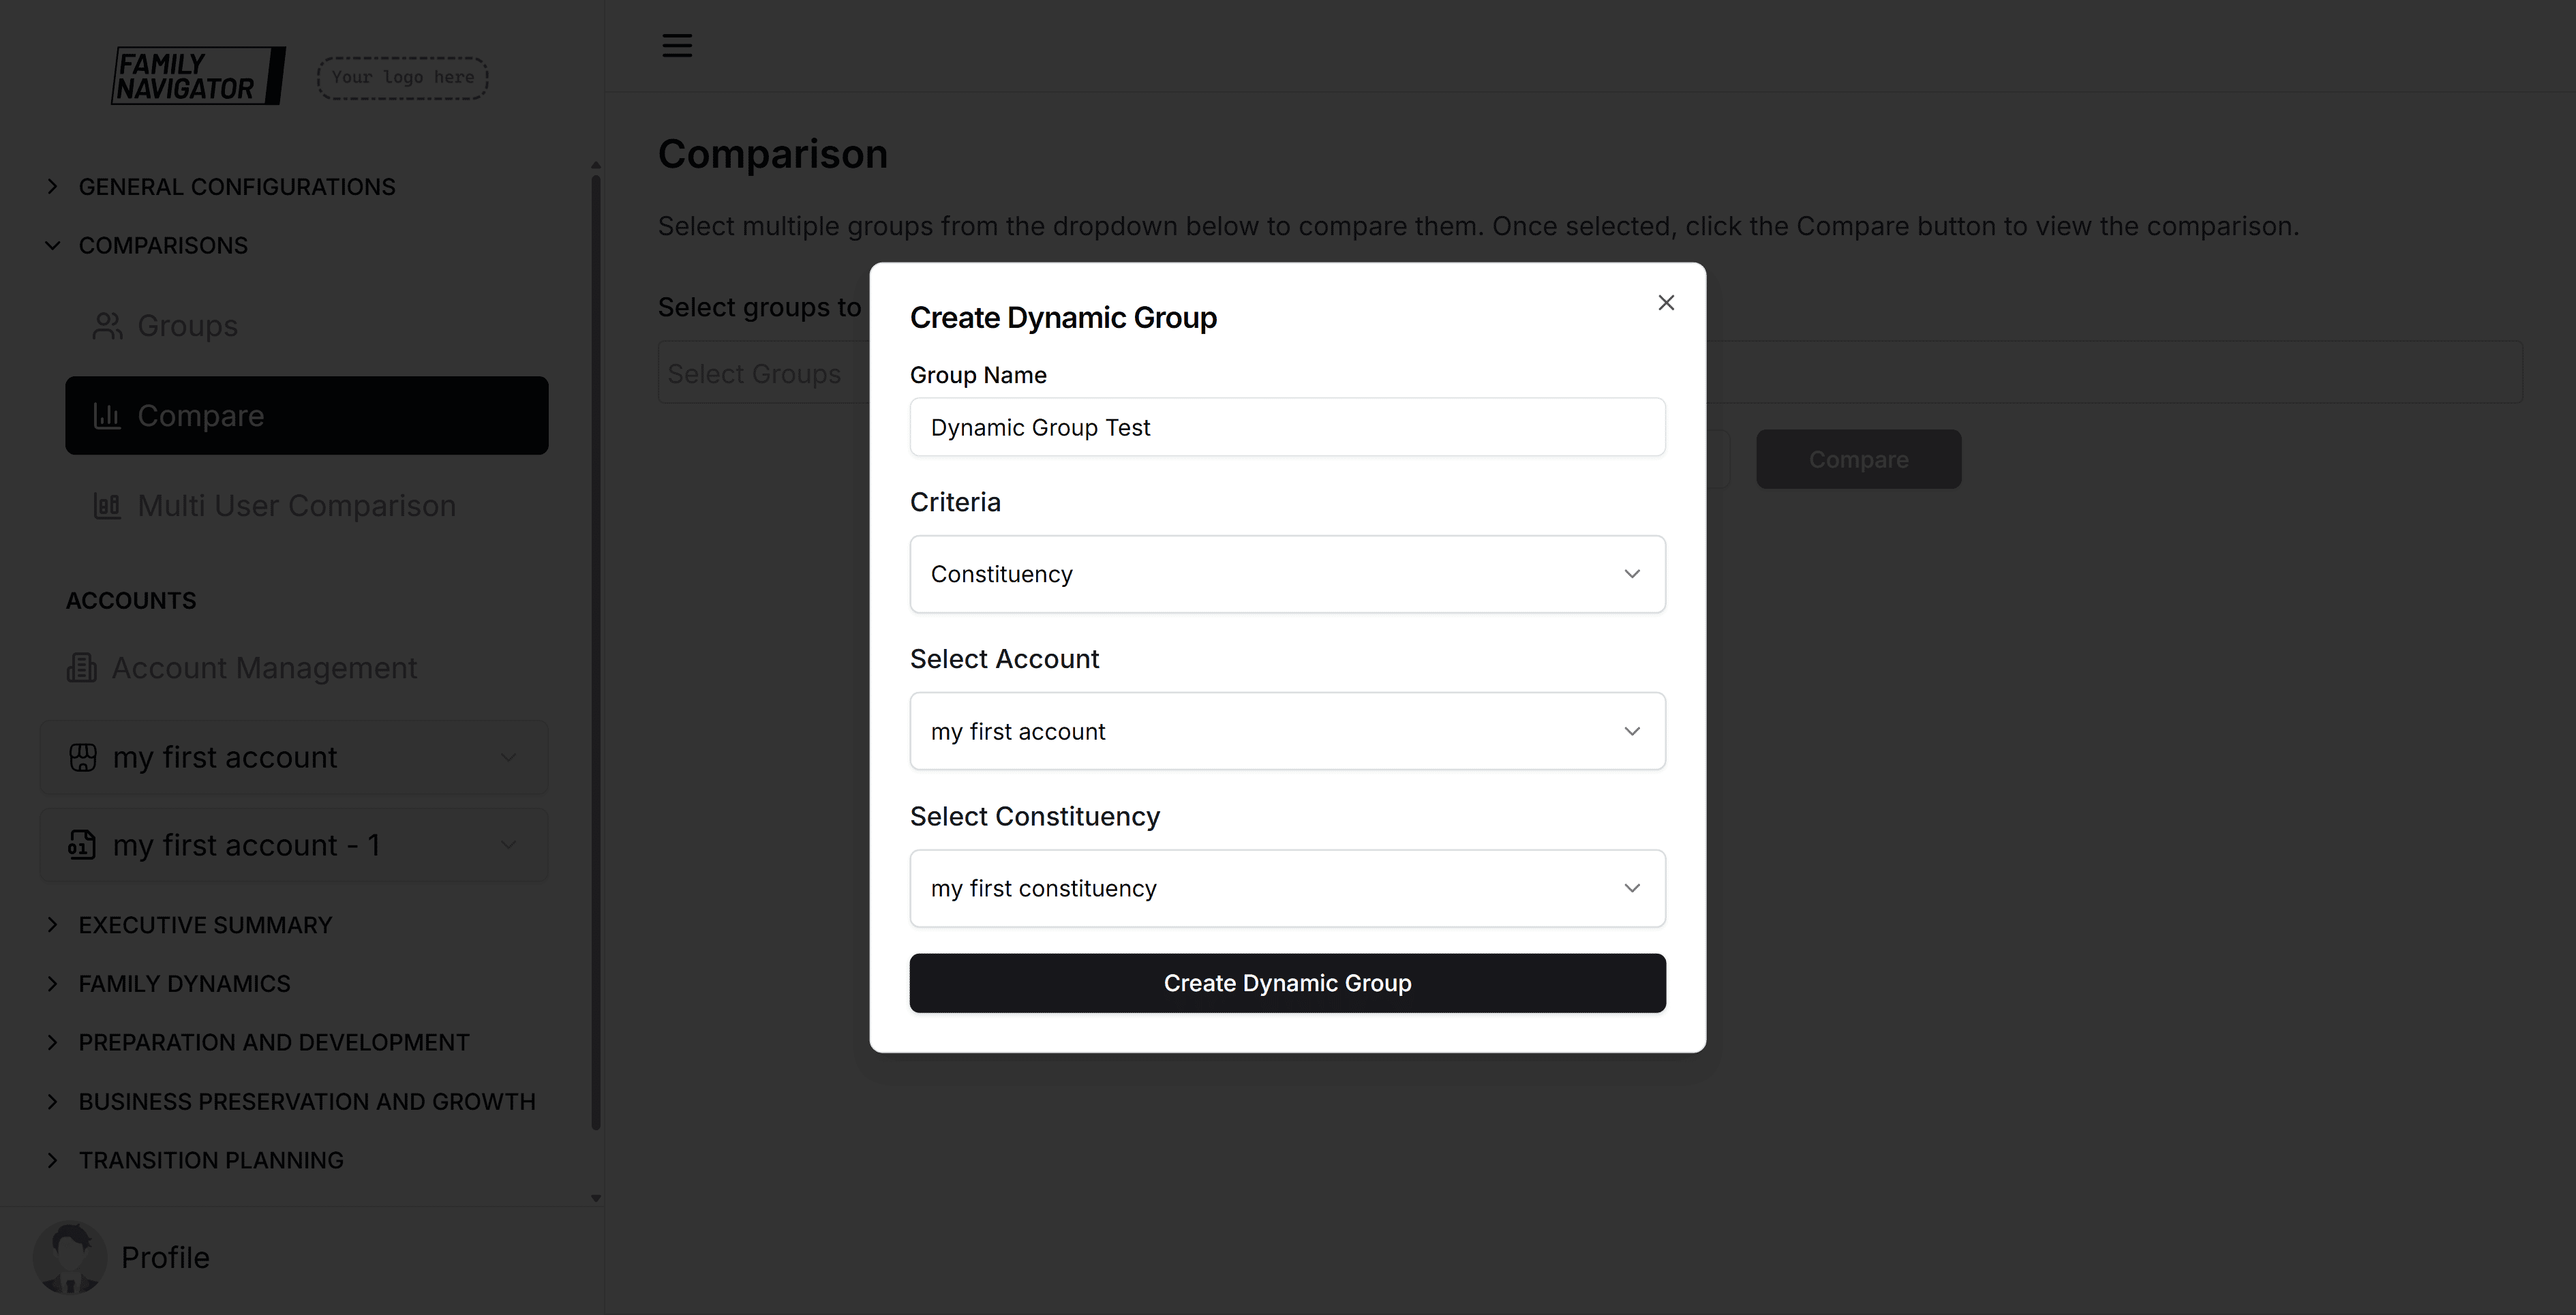
Create Group: Click "Create Dynamic Group" to add it to your selection.
Results Display
Results are organized by categories, with each category showing subcategories in a grid layout.
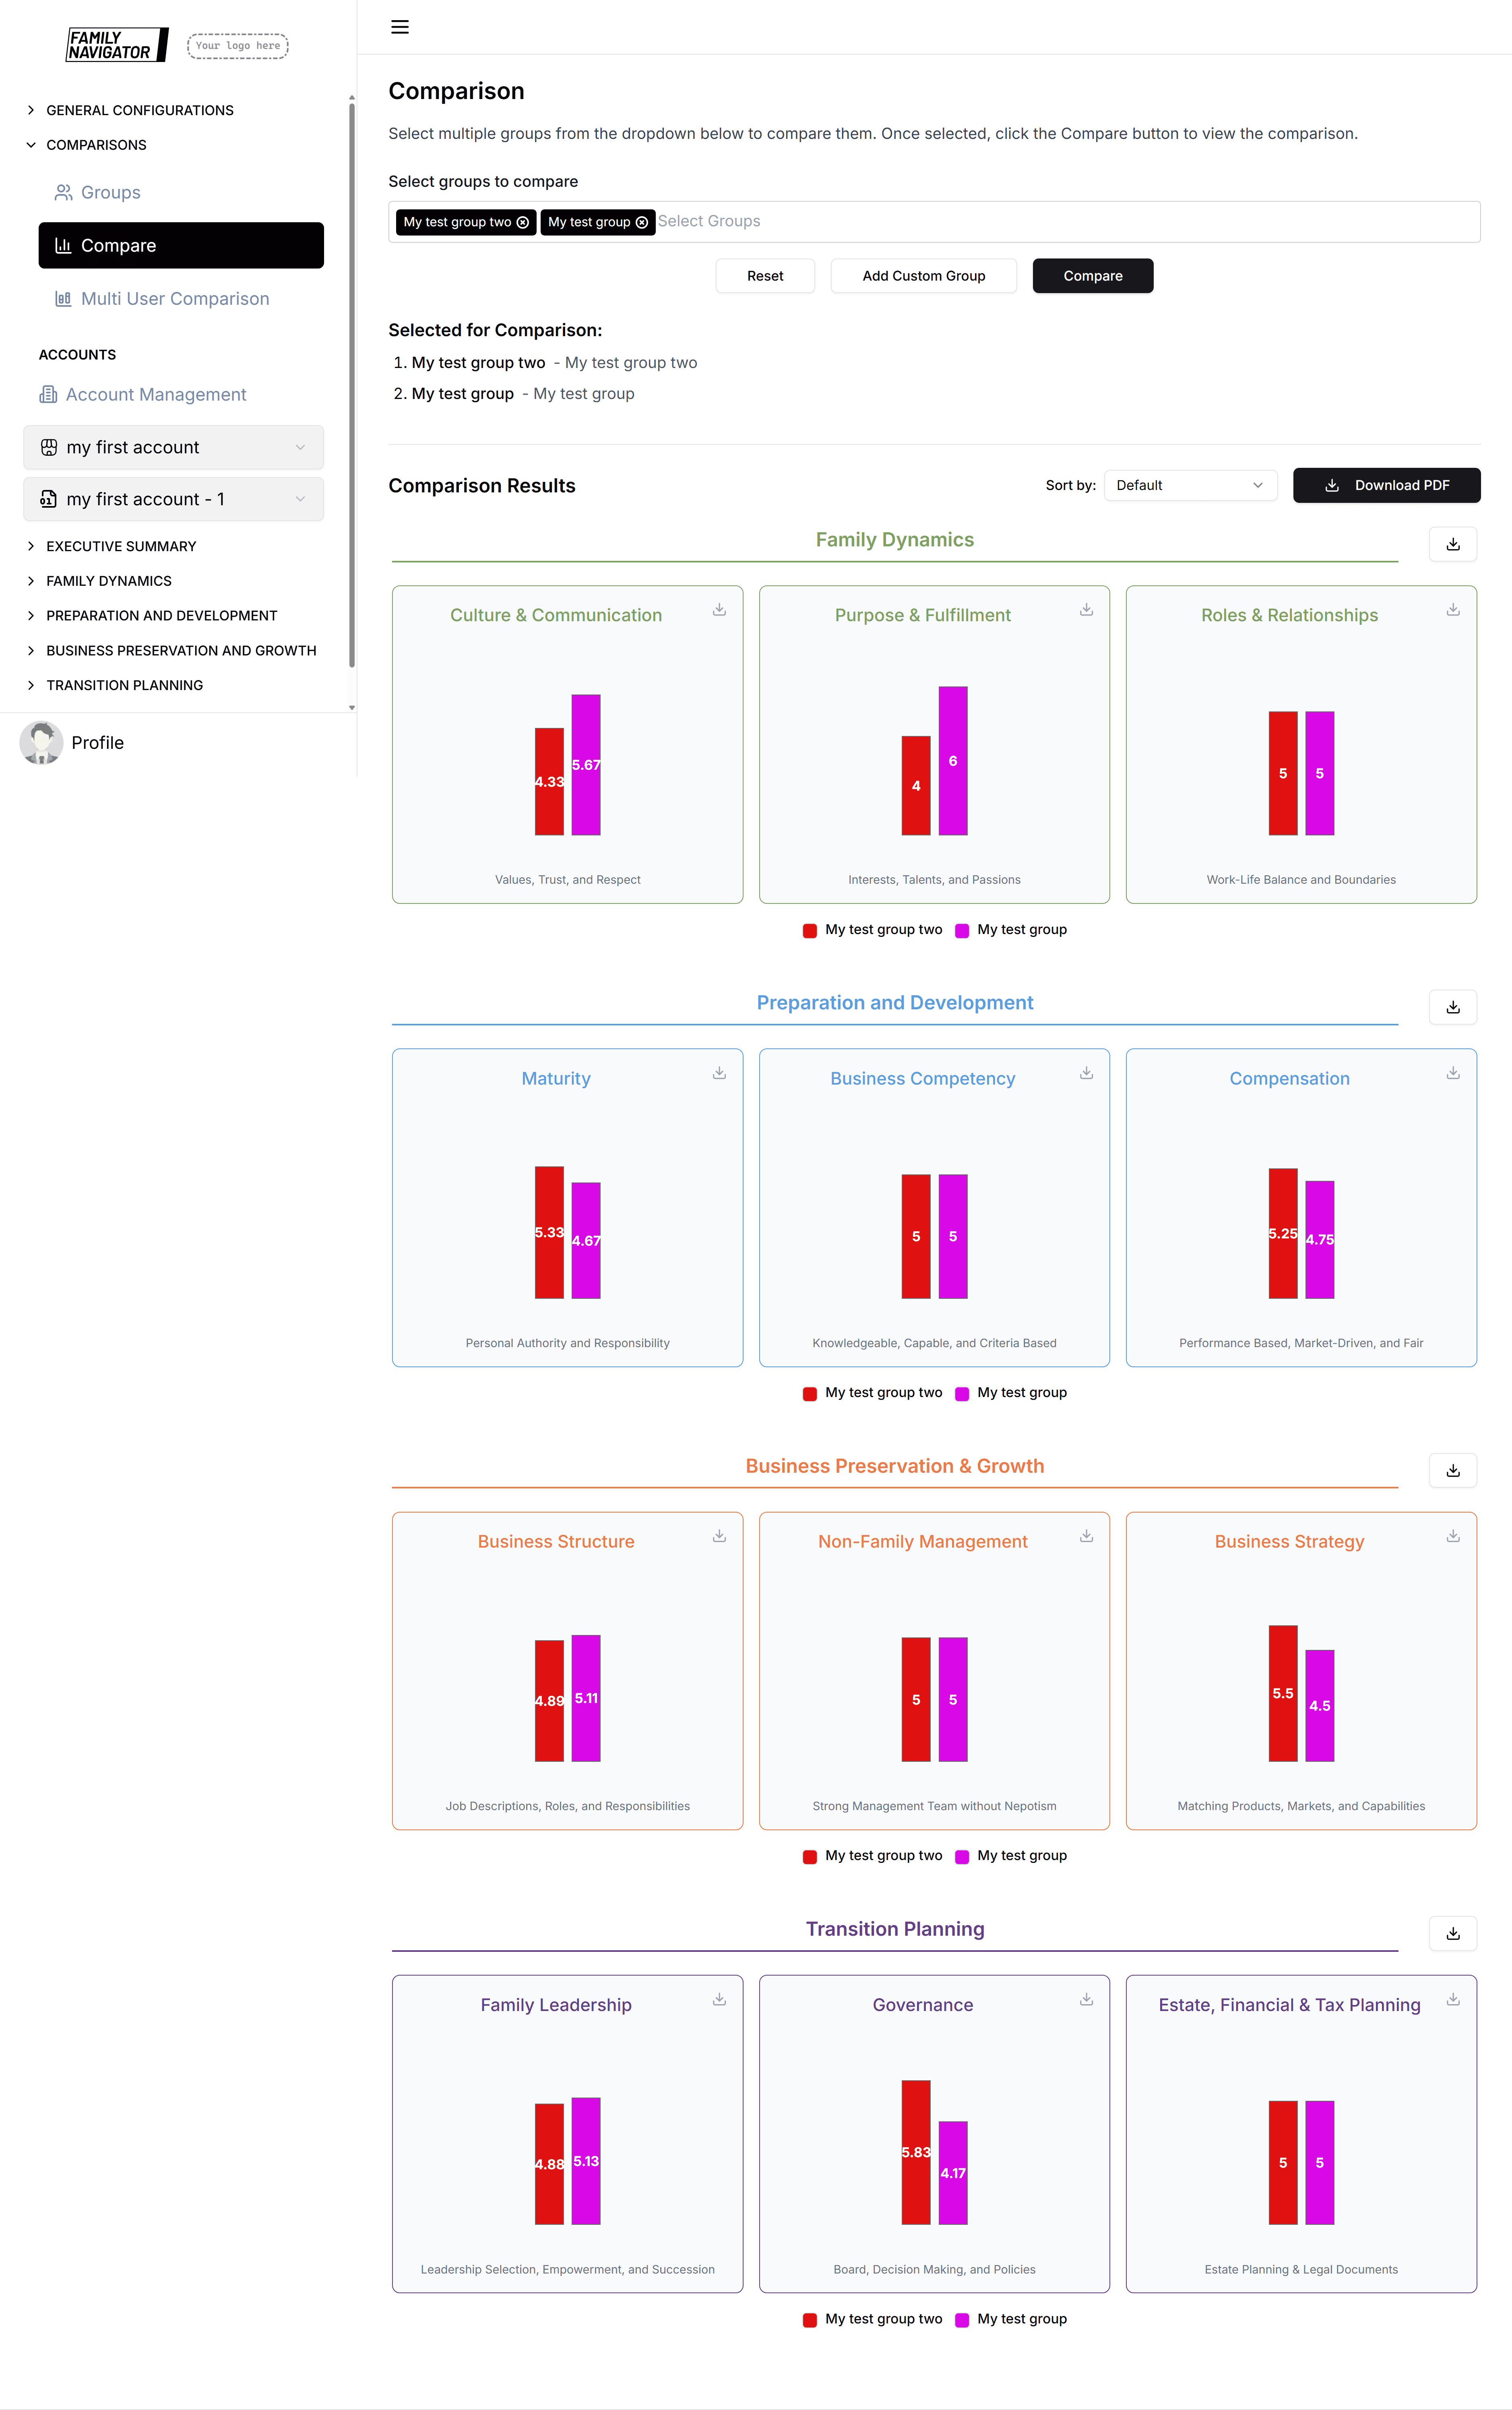
Category Organization
Each category has:
- A colored header matching the category theme
- Subcategories displayed in a 3-column grid on desktop, single column on mobile
Subcategory Charts
Each subcategory shows:
- A vertical bar chart comparing group performance
- Group names with their assigned colors
- Download button for individual charts
Sorting Options
Use the "Sort by" dropdown to reorder the bars in each chart:
- Default: Original order
- Alphabetical: Sort by group name A-Z
- Ascending: Sort by score low to high
- Descending: Sort by score high to low
Downloading Results
Individual Chart Downloads
Click the download icon next to any subcategory title to download that specific chart as an image.
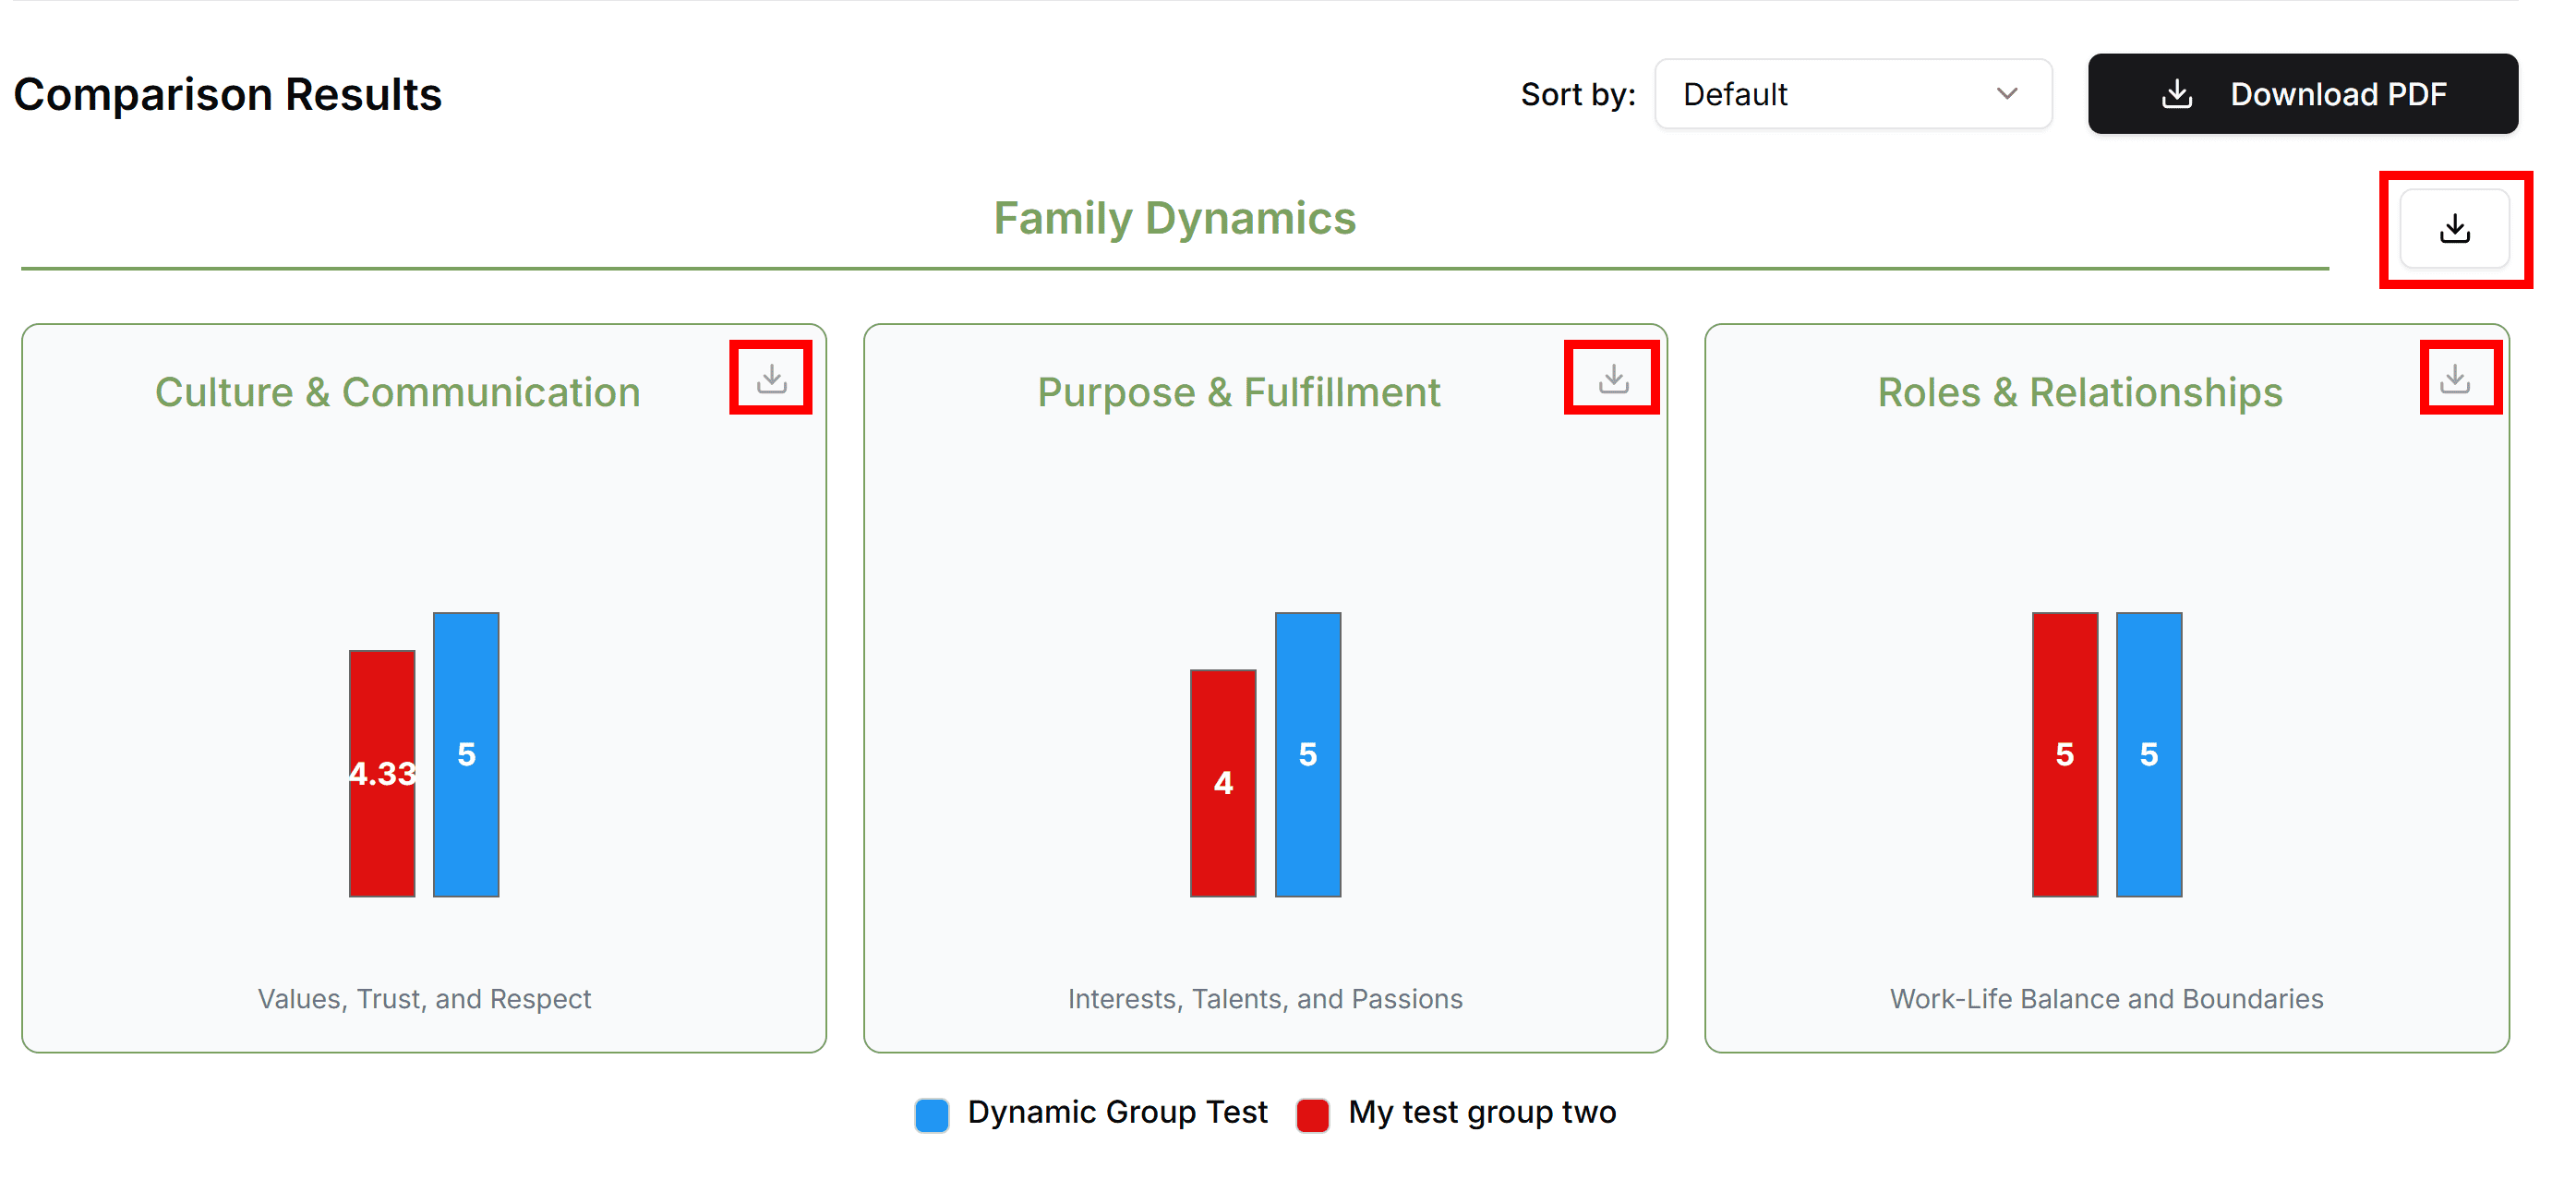
Full Report Download
When all data is loaded, a "Download PDF" button appears in the top-right corner.
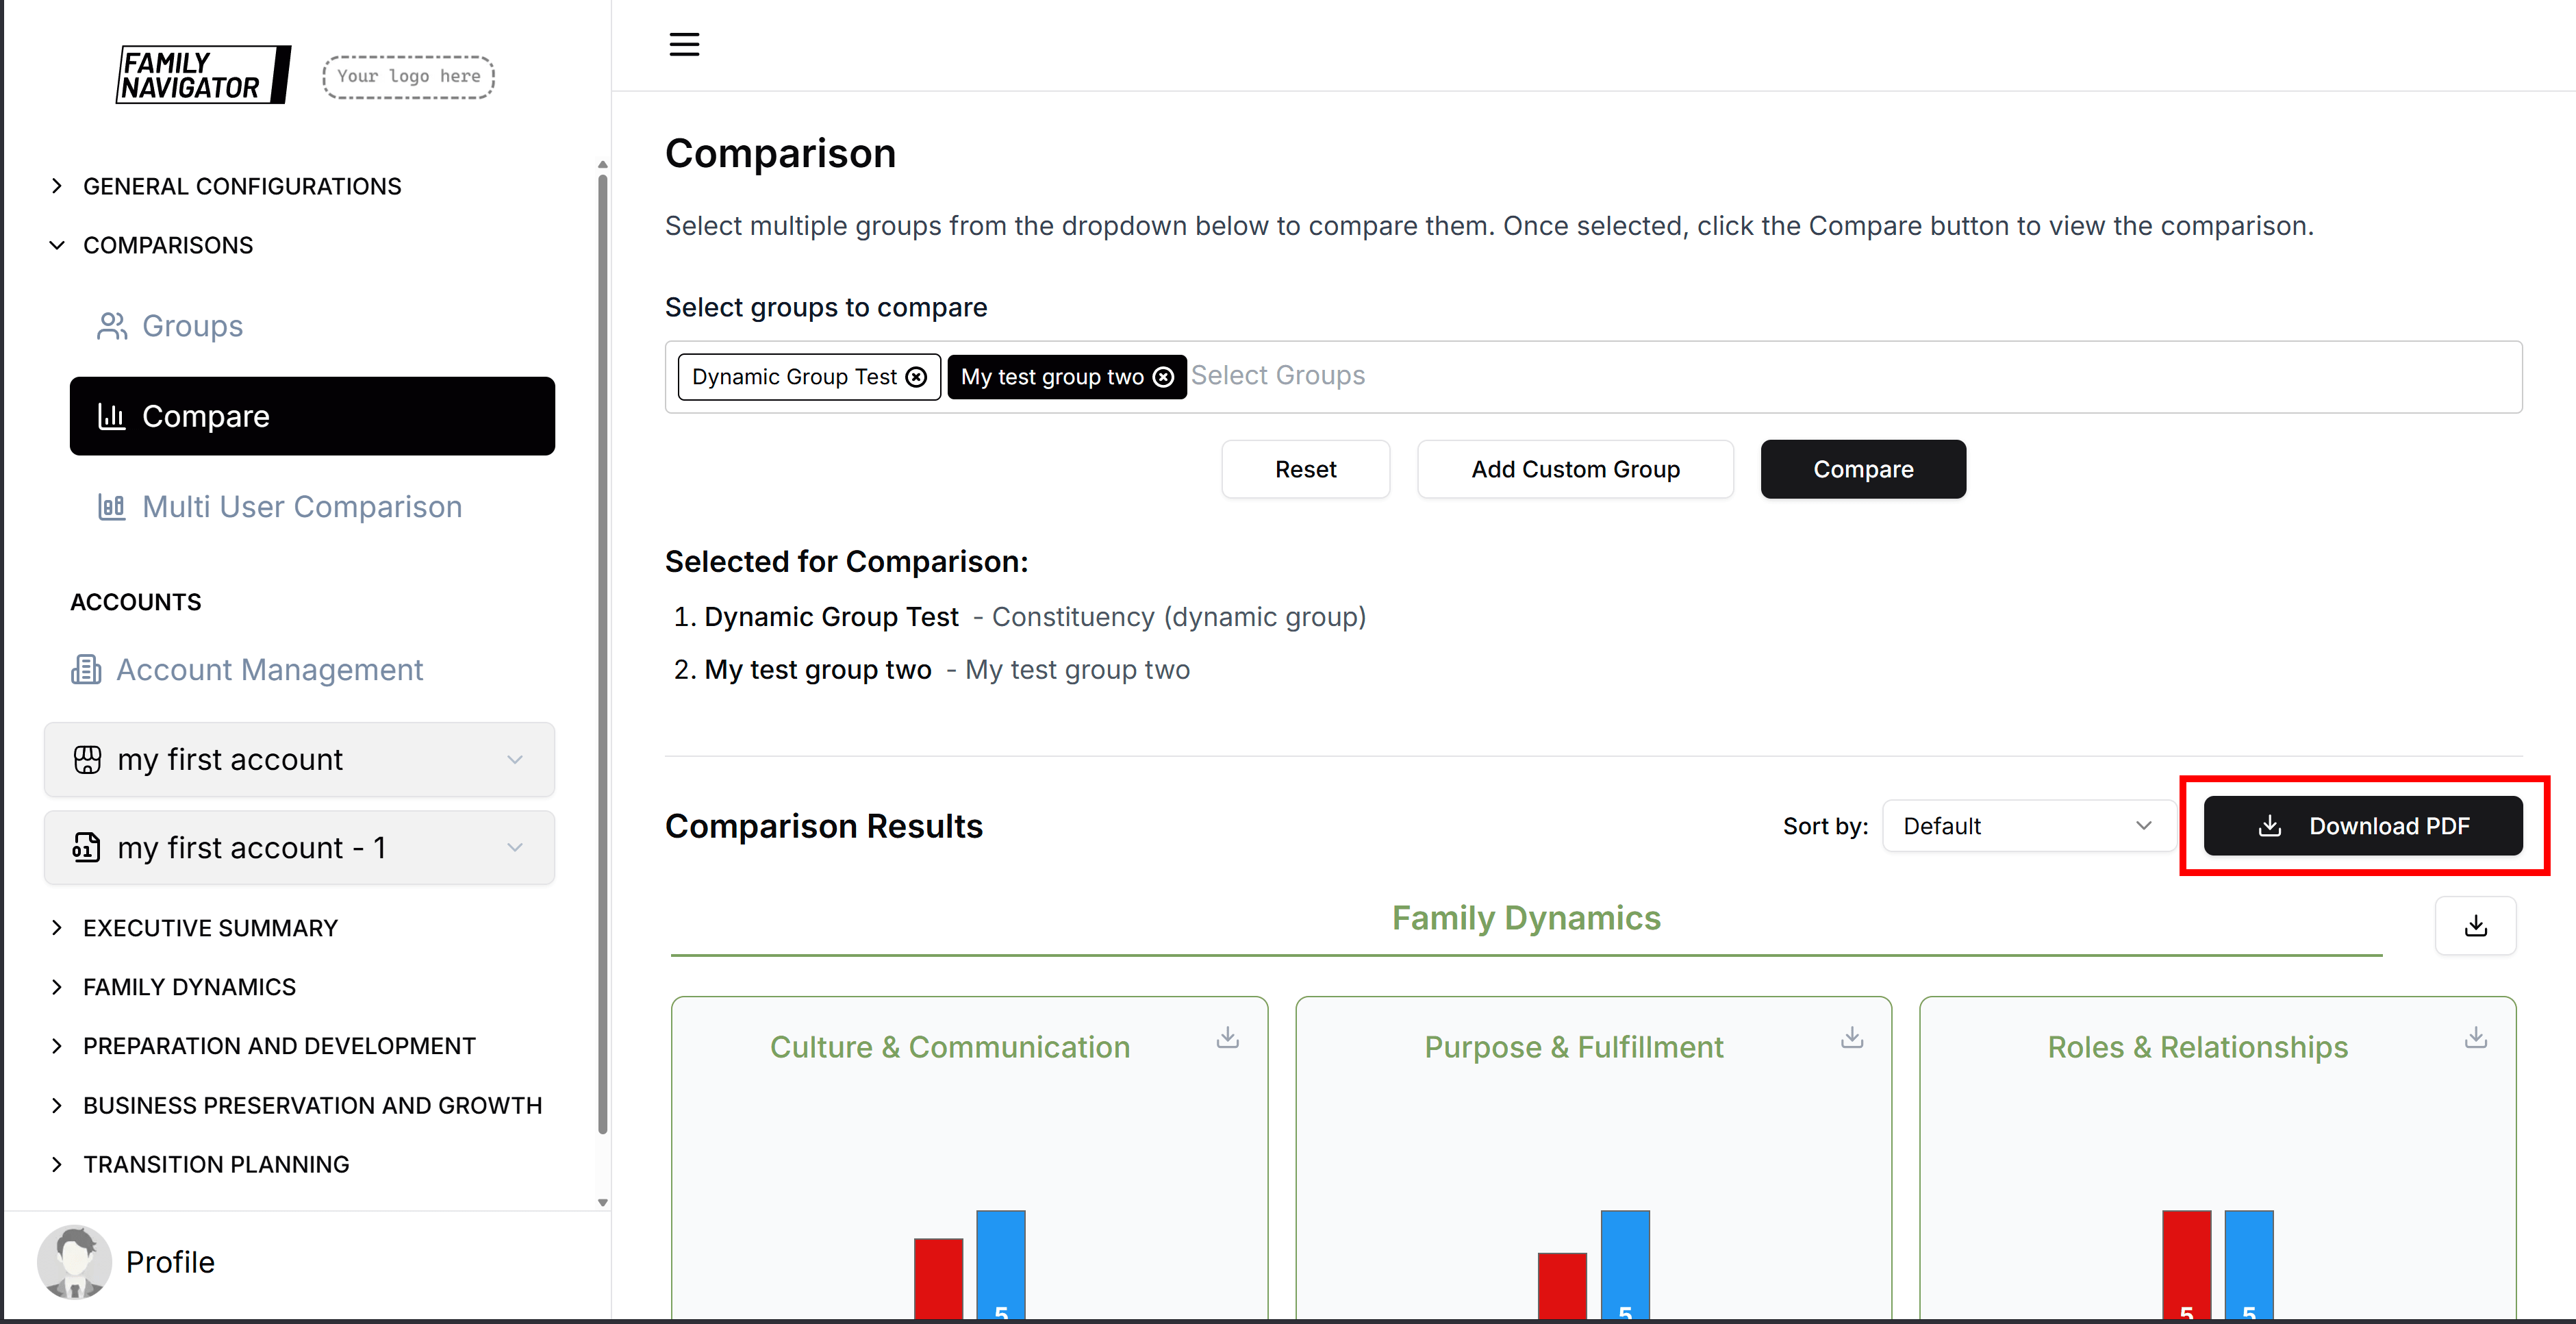
This generates a comprehensive PDF report with all comparison charts.
Error Handling
No Groups Selected
The Compare button is disabled until at least one group is selected.
Data Loading Errors
If data fails to load, error messages will appear with details.
Performance Considerations
- Large numbers of groups may take longer to process
- Consider limiting selections to 5-7 groups for optimal performance
- PDF generation may take additional time for complex reports
Best Practices
Group Selection
- Choose groups with meaningful differences for insightful comparisons
- Limit to 3-5 groups for readability
- Use descriptive names for custom groups
Troubleshooting
- Compare Button Disabled: Ensure at least one group is selected
- No Results Showing: Check that selected groups have associated user data
- Charts Not Loading: Refresh the page and try again
- PDF Download Failing: Try downloading individual charts instead
- Custom Group Not Creating: Verify all required fields are filled