Multi-User Comparison
This guide explains how to use the Multi-User Comparison feature in Family Navigator to compare individual user responses side-by-side across different questions and categories.
Overview
The Multi-User Comparison page allows you to select multiple individual users and visualize their questionnaire responses in a detailed comparison format. Unlike group comparisons, this feature focuses on individual user responses, making it ideal for analyzing specific user patterns or conducting detailed assessments.
Accessing Multi-User Comparison
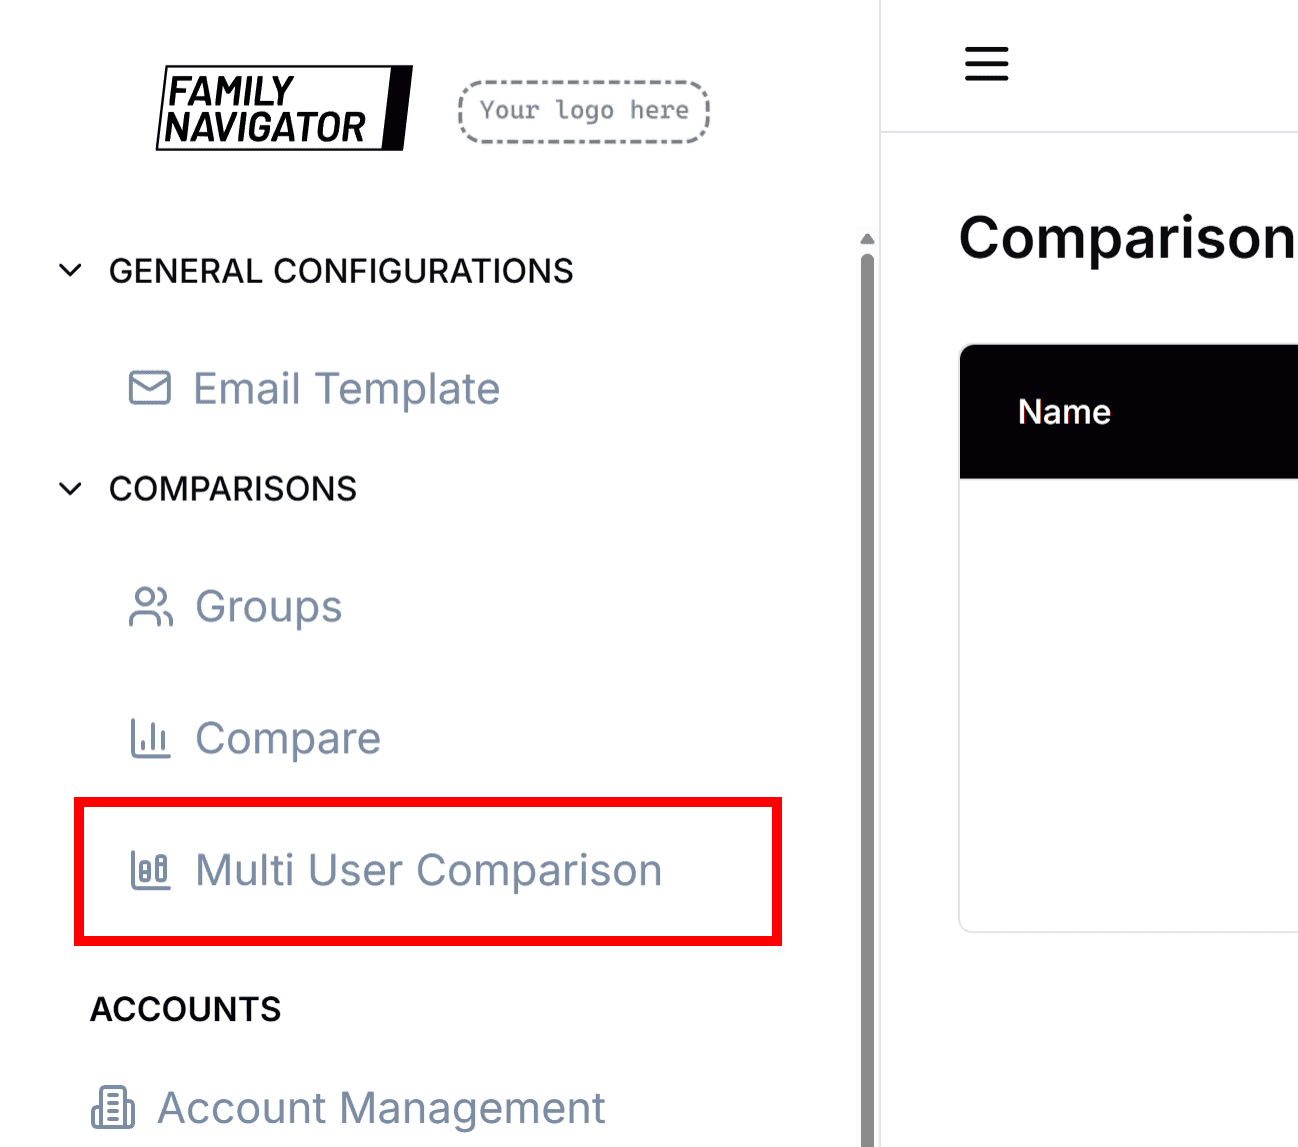
- Log in to the Family Navigator application.
- Navigate to the "Multi-User Comparison" section from the main menu.
Selecting Users for Comparison
Step 1: Search and Add Users
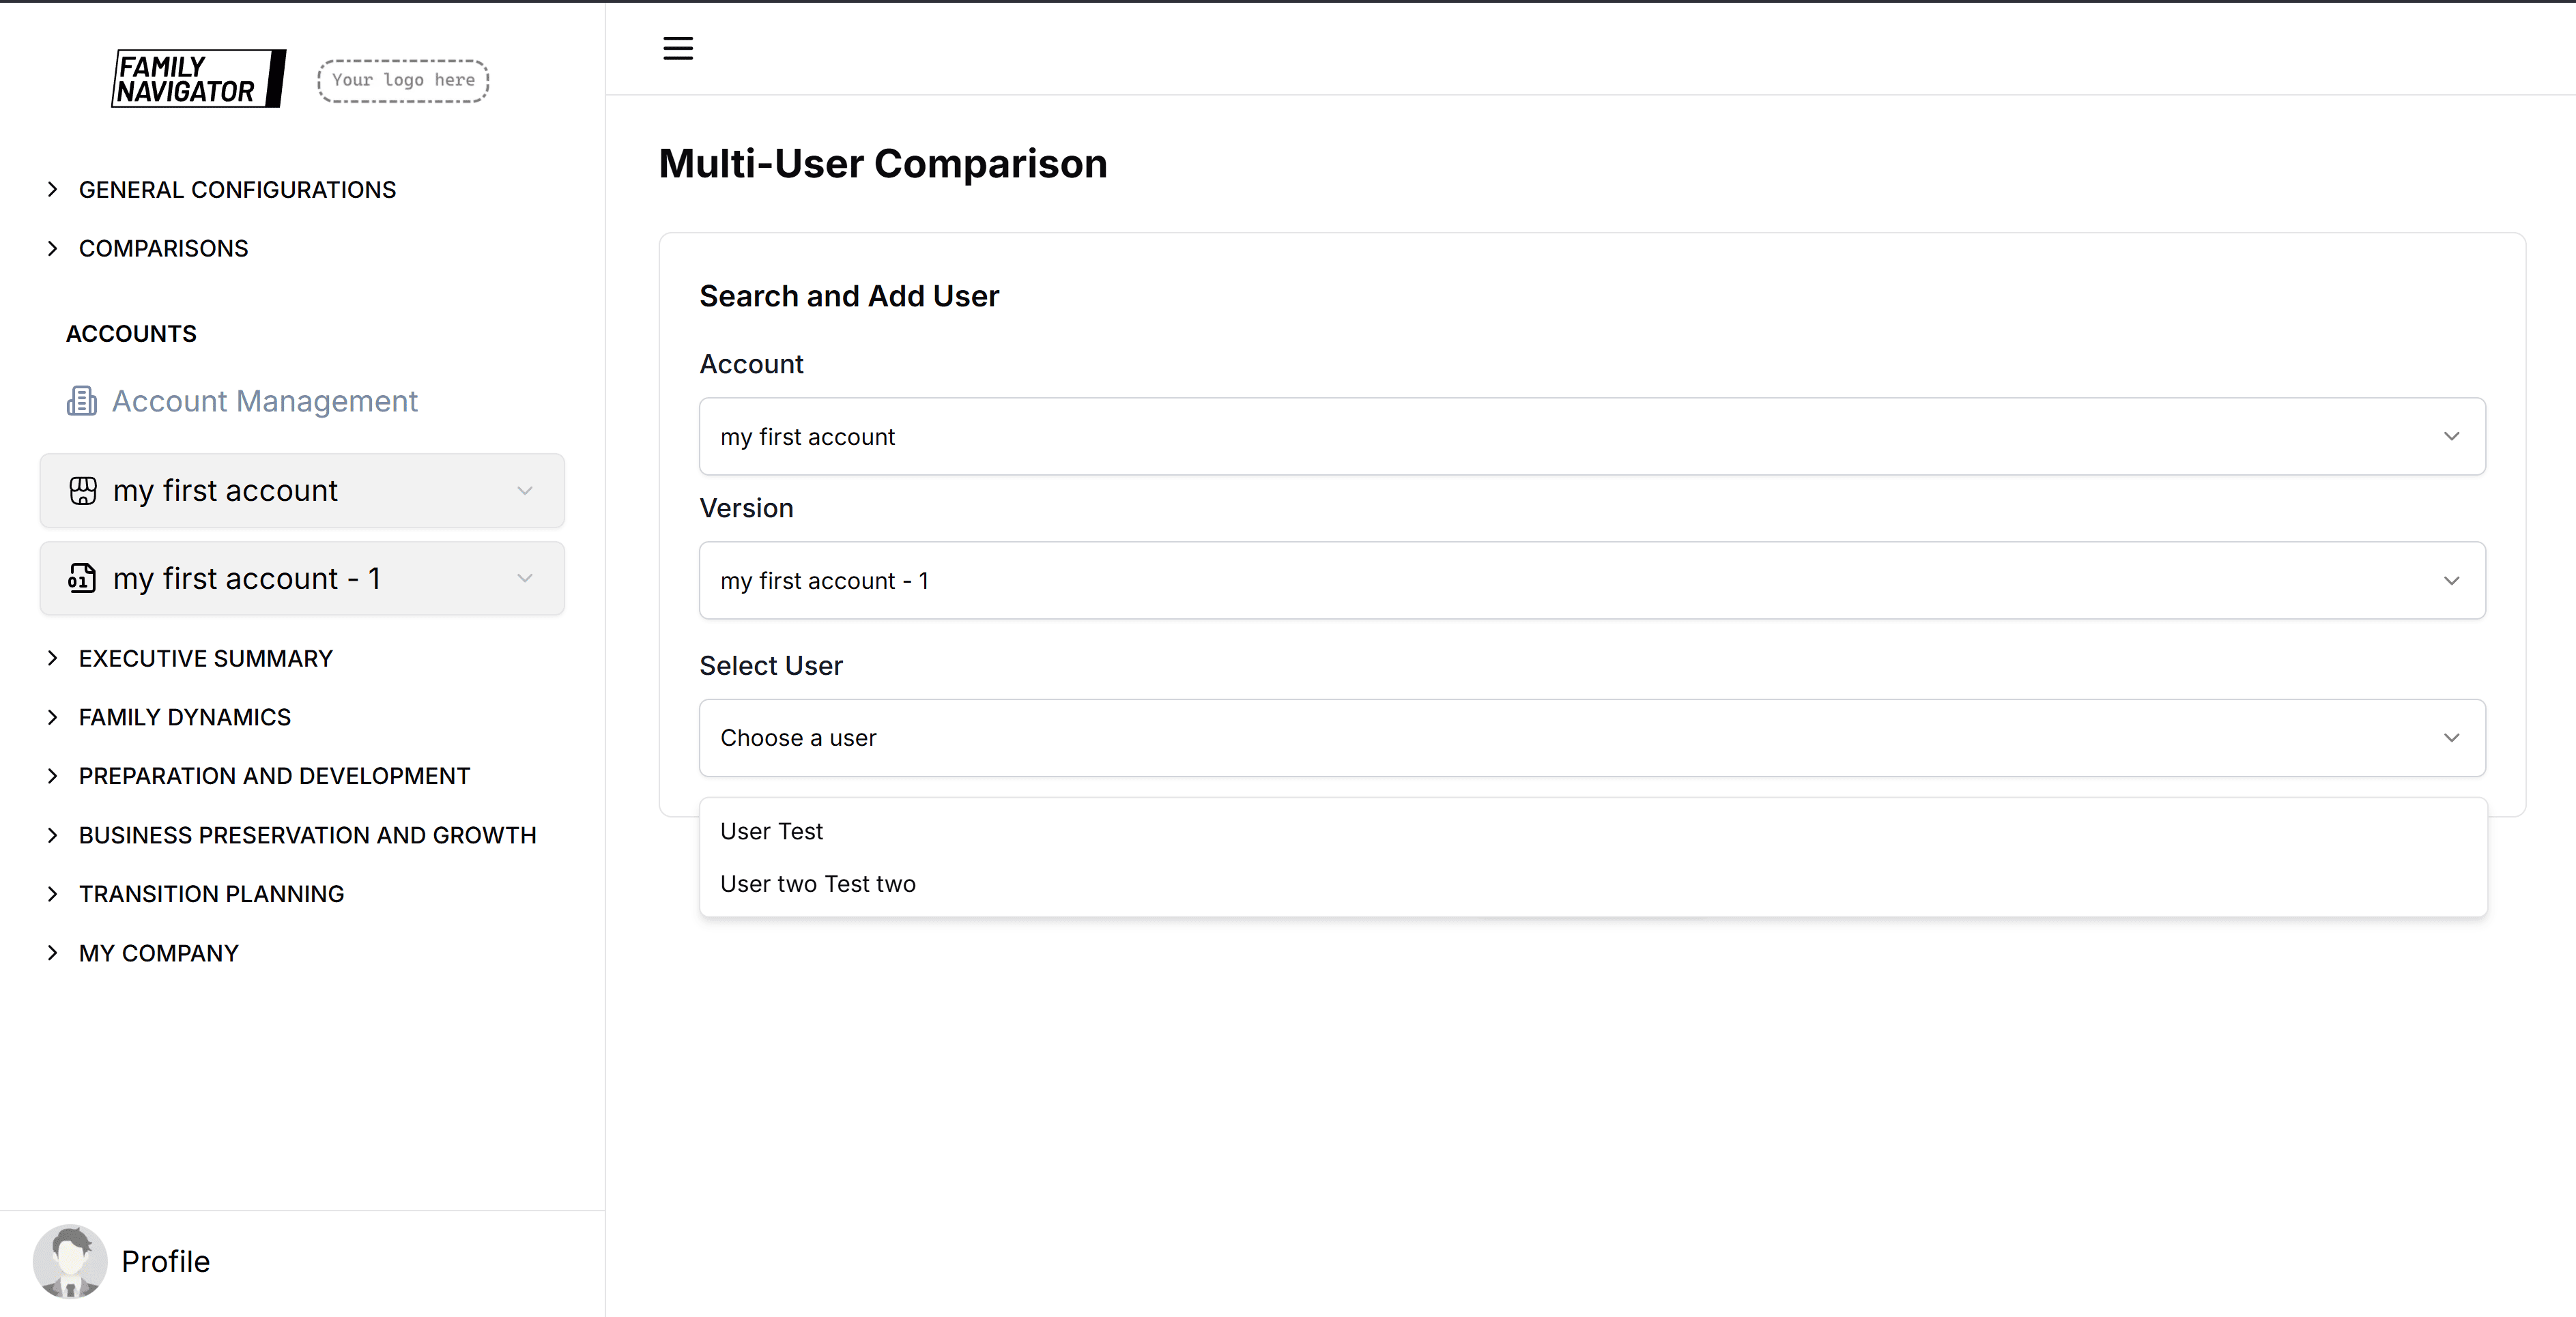
The main interface provides a user search section where you can find and add individual users.

Step 2: Filter Users
Use the dropdown filters to narrow down your search:
- Account: Choose the parent account/organization
- Version: Select the specific account version
Step 3: Select Specific User
Once you've selected Account and Version, the User dropdown will populate with available users from that account.
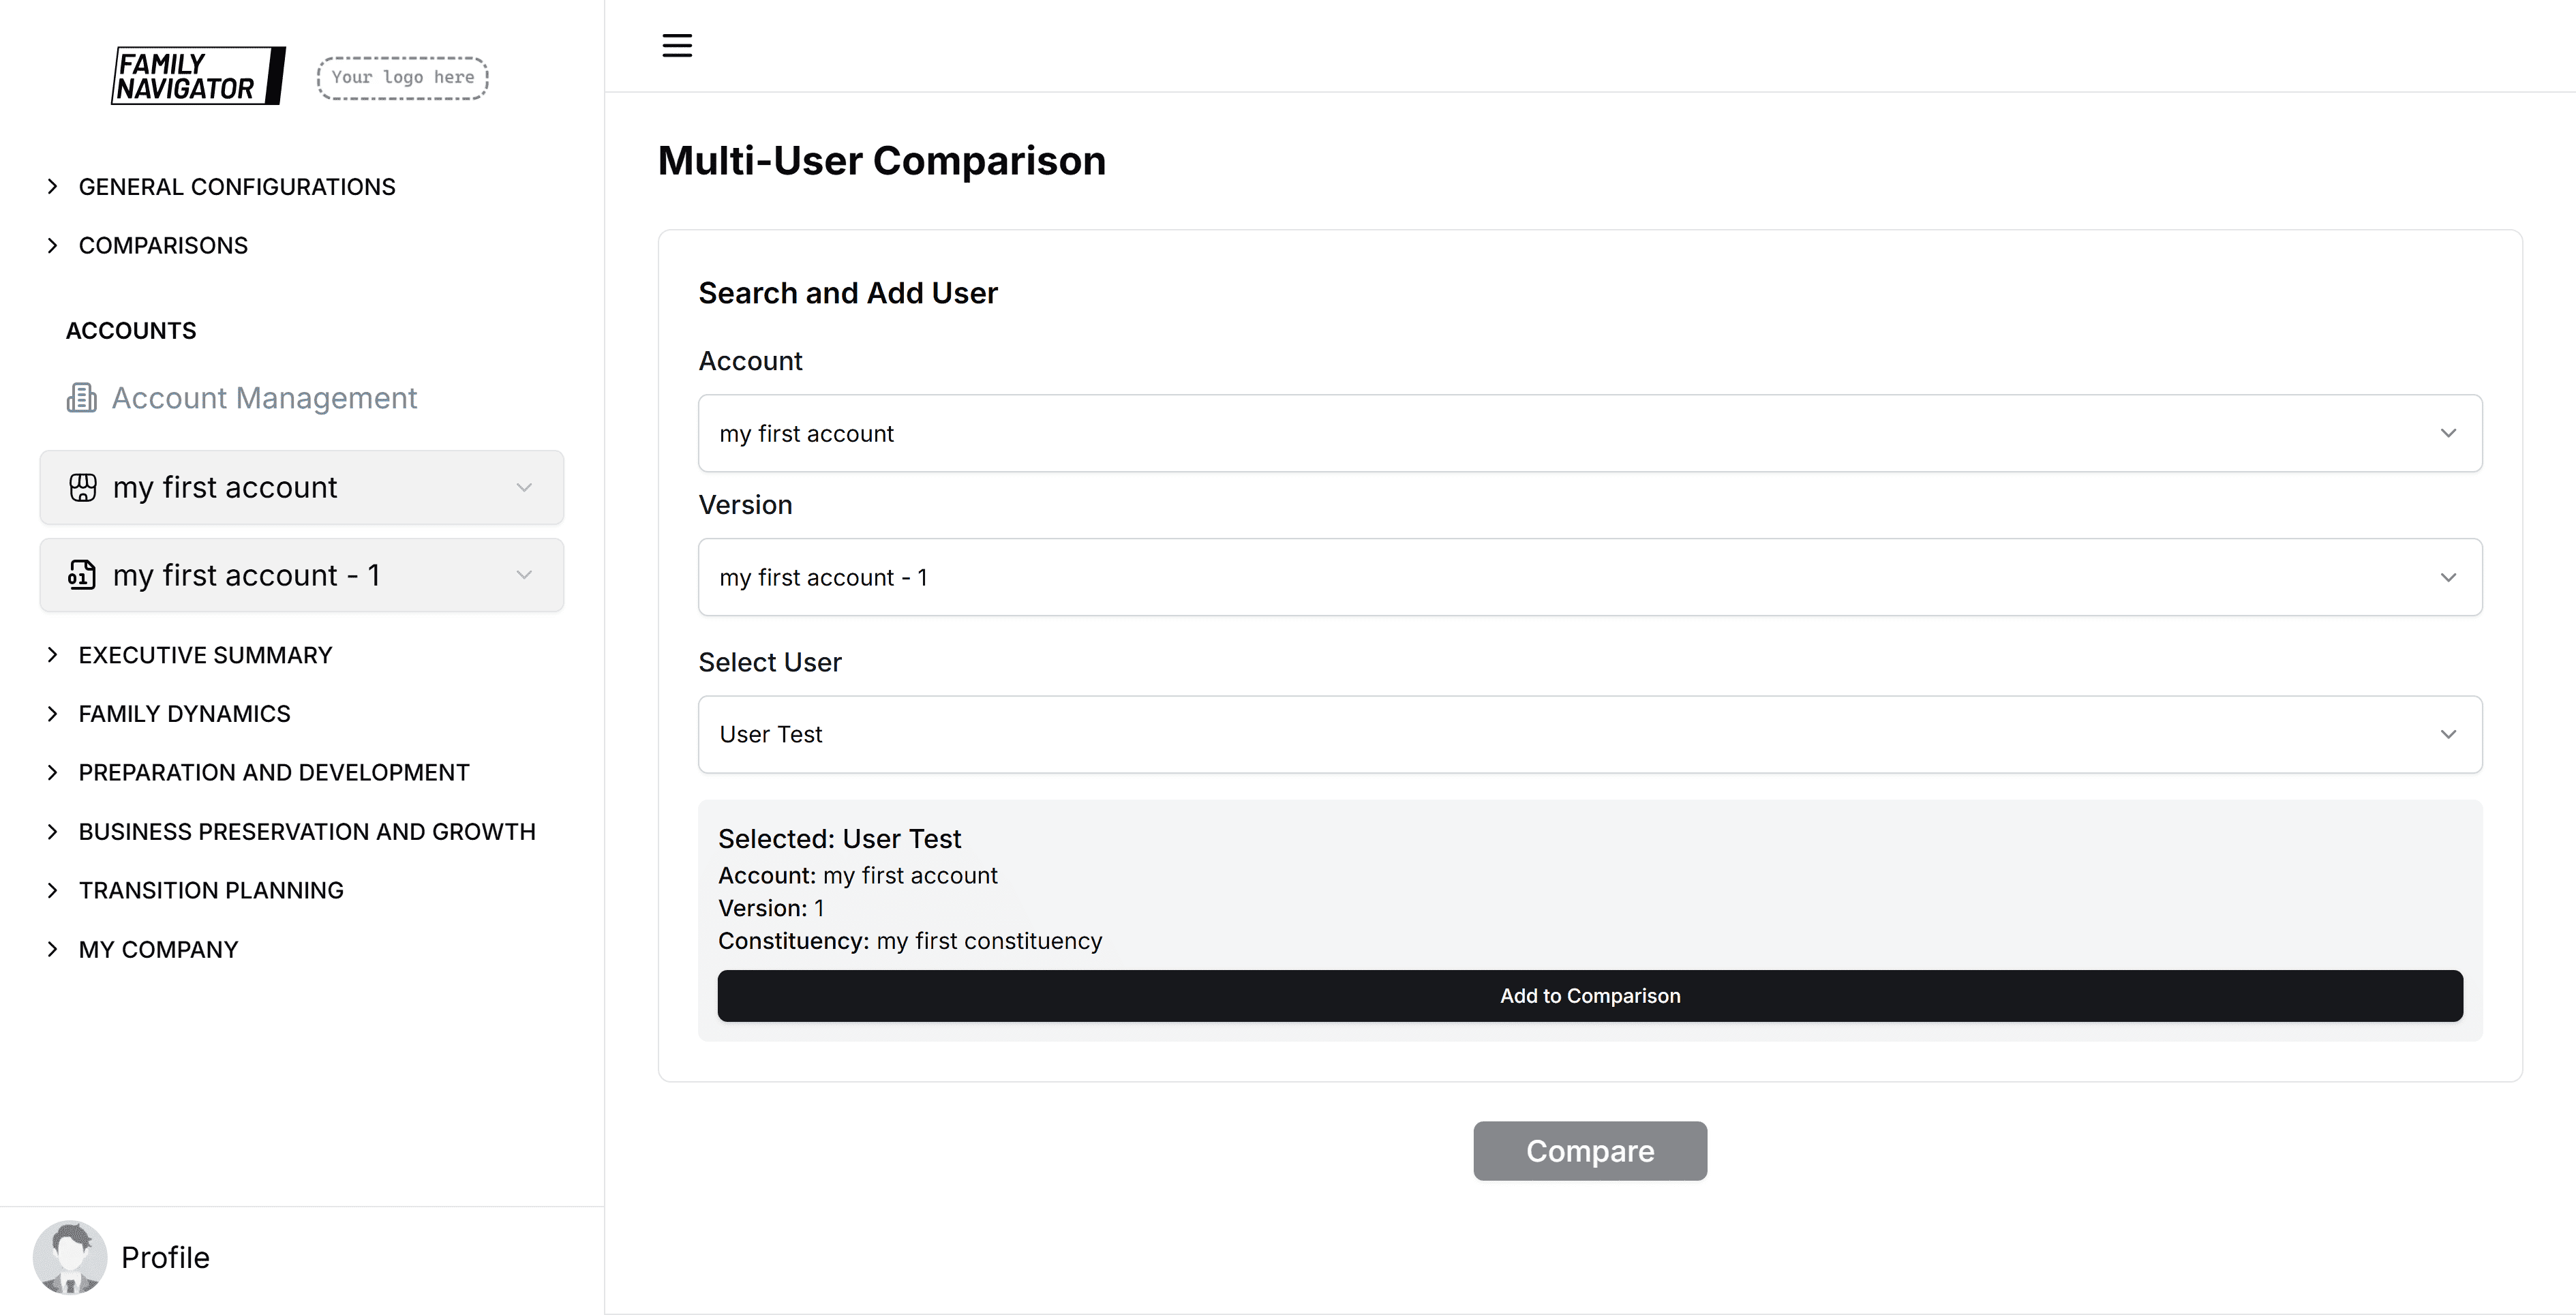
Step 4: Add User to Comparison
After selecting a user, their details will appear in a preview card showing:
- Full name
- Account name
- Version (if applicable)
- Constituency
Click "Add to Comparison" to include them in your comparison list.
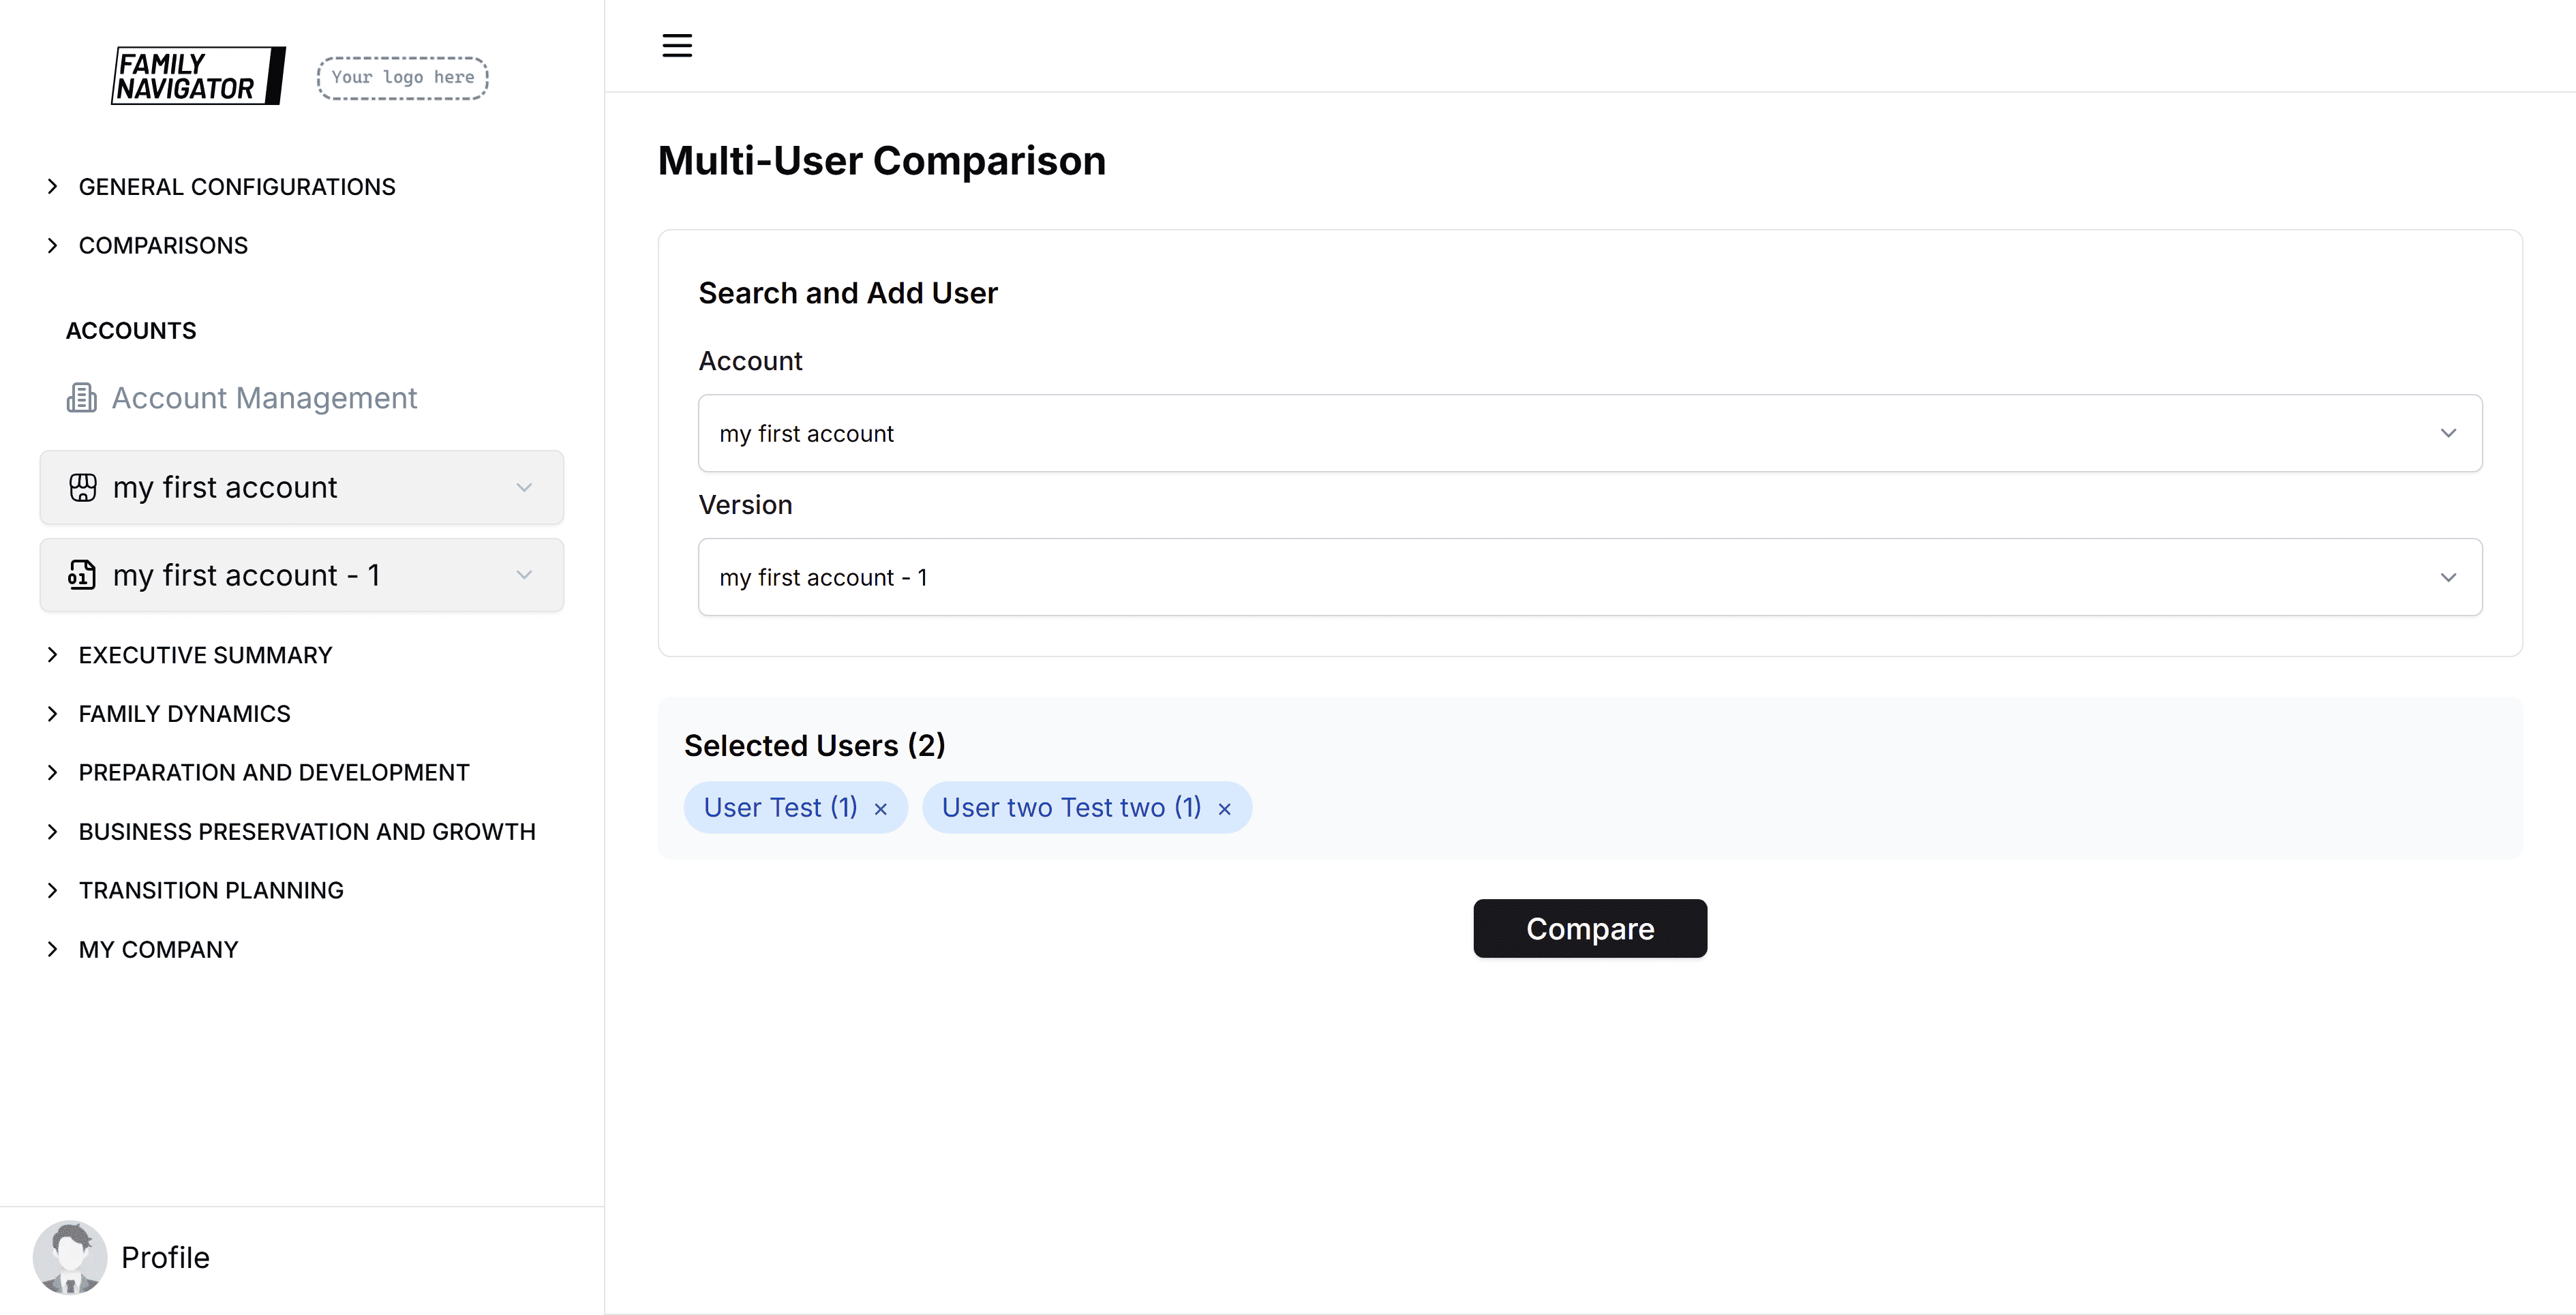
Step 5: Repeat for Multiple Users
Continue the process to add multiple users. Each added user will appear as a colored tag in the "Selected Users" section.
Starting the Comparison
Minimum Requirements
You need at least 2 users selected to perform a comparison. The "Compare" button will be disabled until this requirement is met.
Initiating Comparison
Click the "Compare" button to generate the comparison results.
Viewing Comparison Results
Loading State
While processing, you'll see a loading indicator.
Results Layout
Results are organized by categories and subcategories, with each question displayed as a horizontal bar chart.
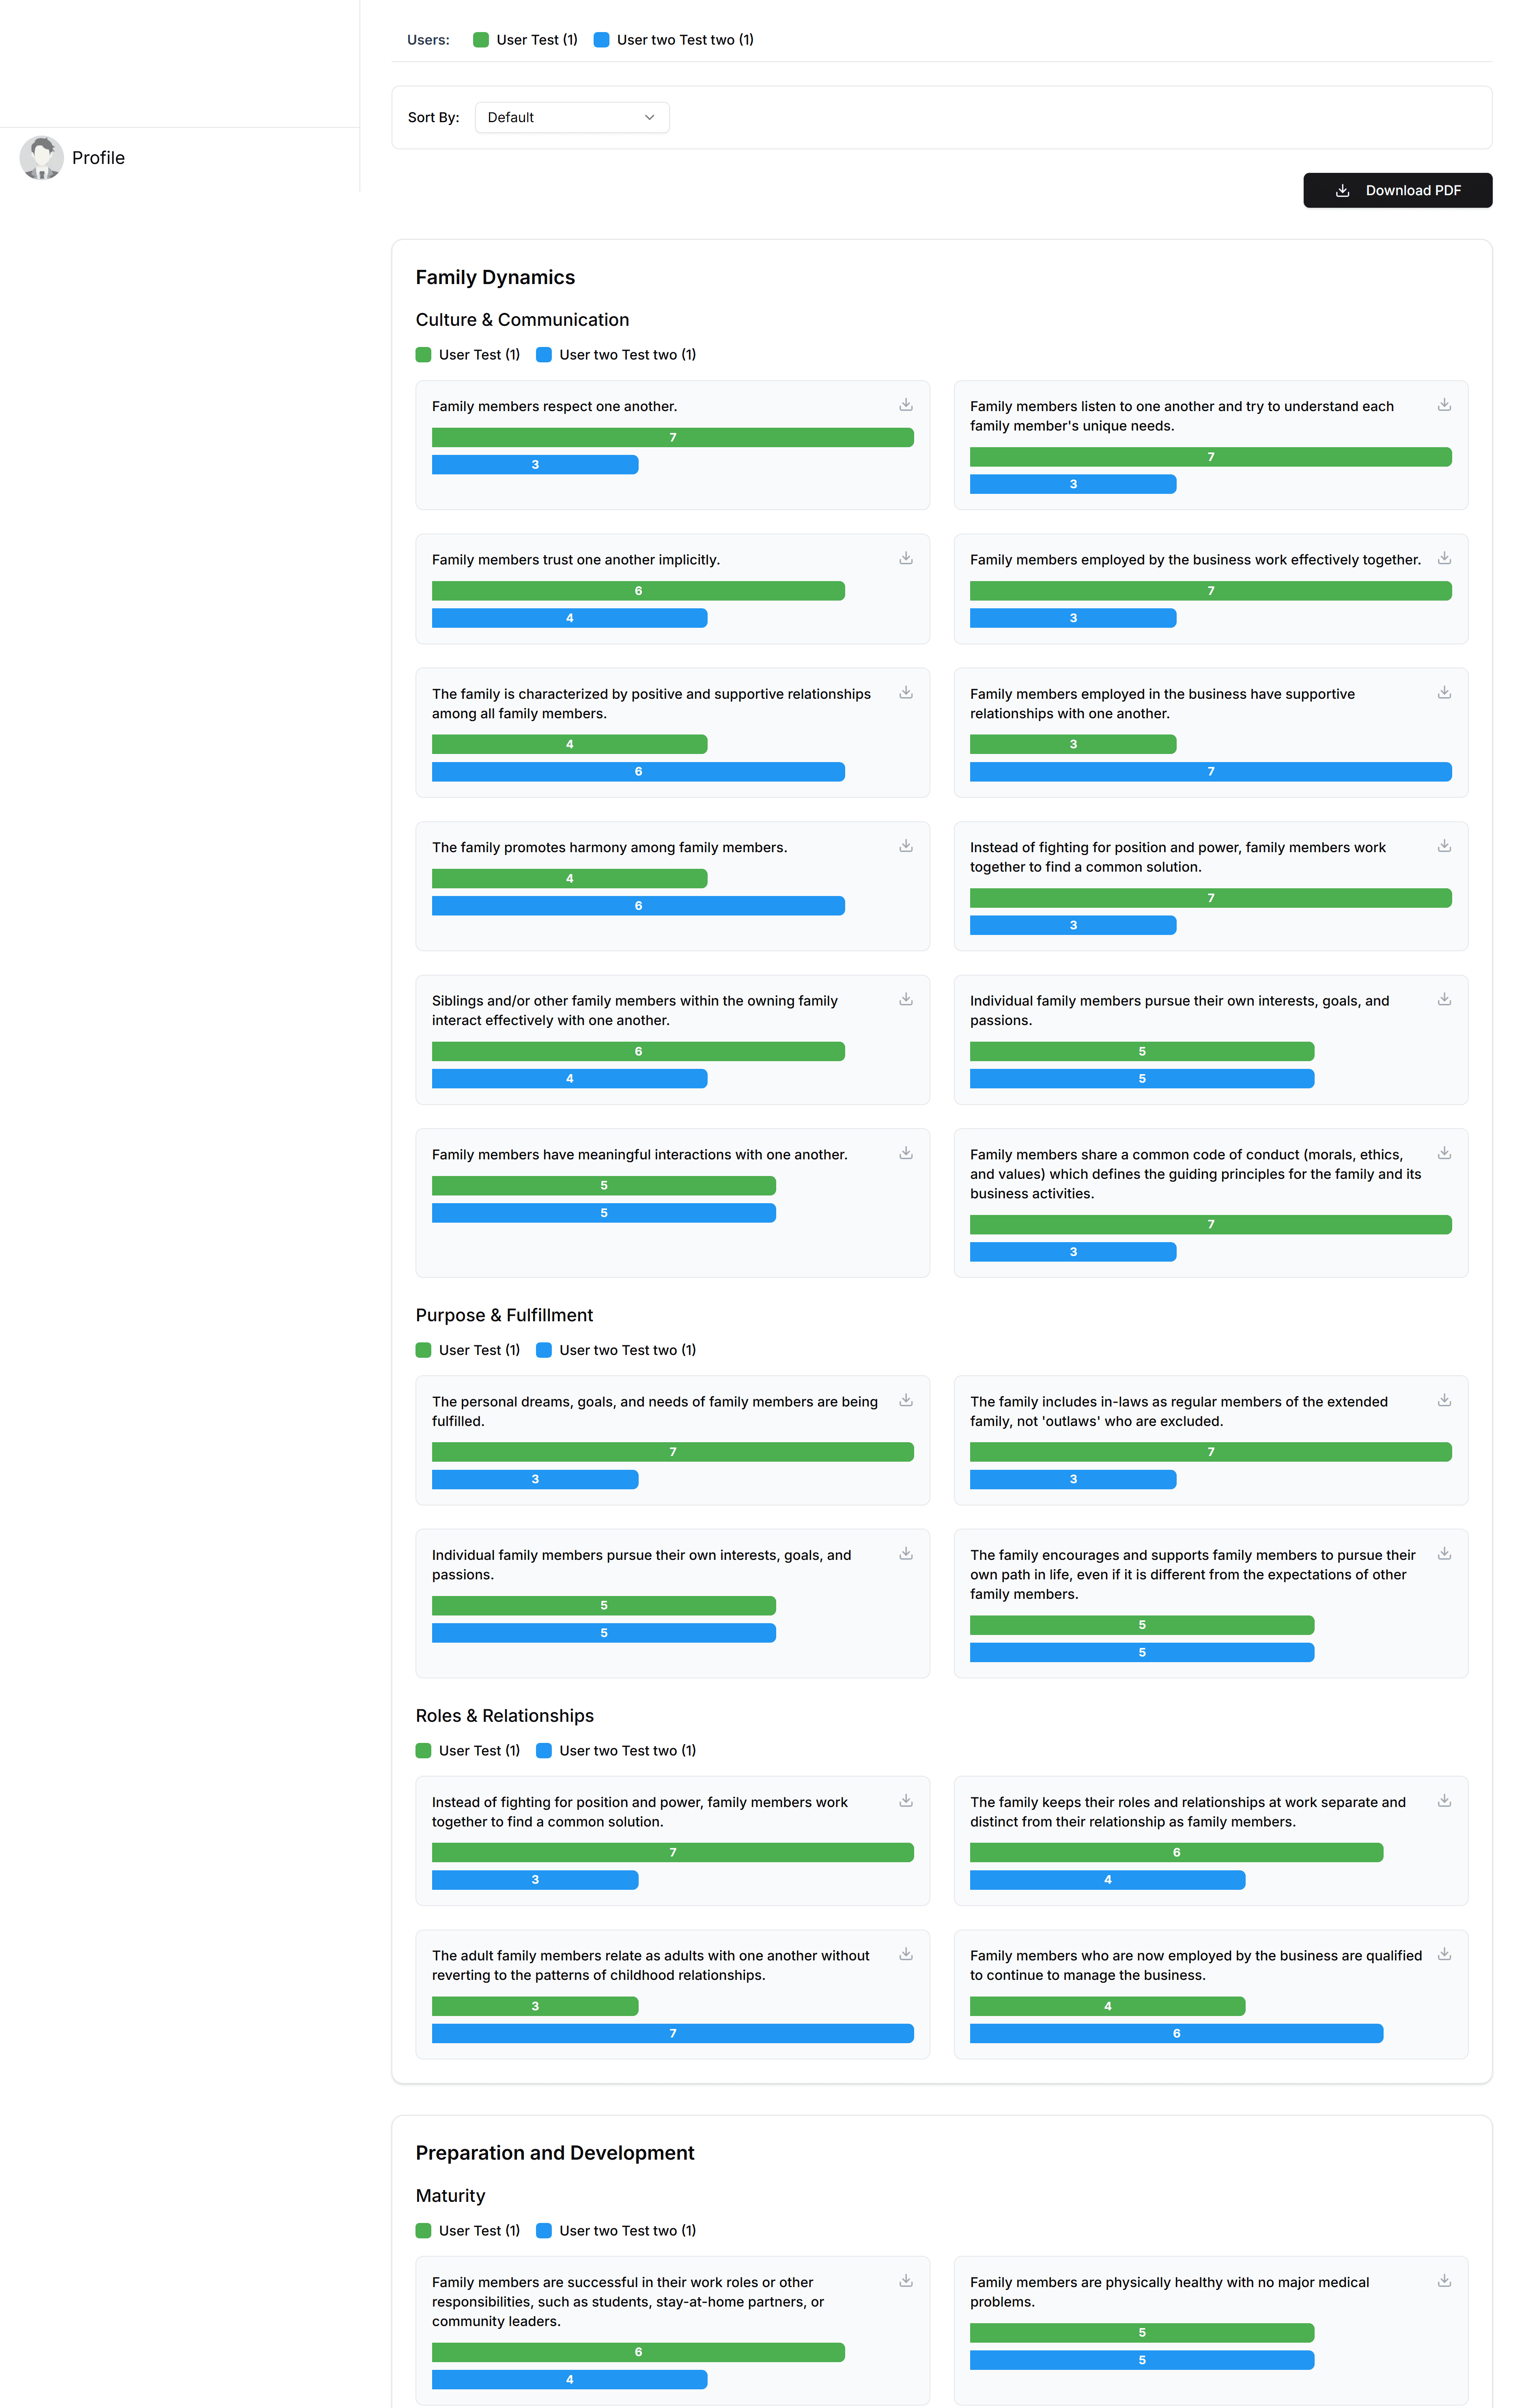
Category Organization
- Each category is displayed in its own card
- Subcategories are grouped within categories
- Questions are arranged in a responsive grid (2 columns on large screens)
Question Charts
Each question shows:
- Question text at the top
- Horizontal bars representing each user's response
- Color-coded bars matching user legend
- Response values displayed on bars (or "N/A" if no response)
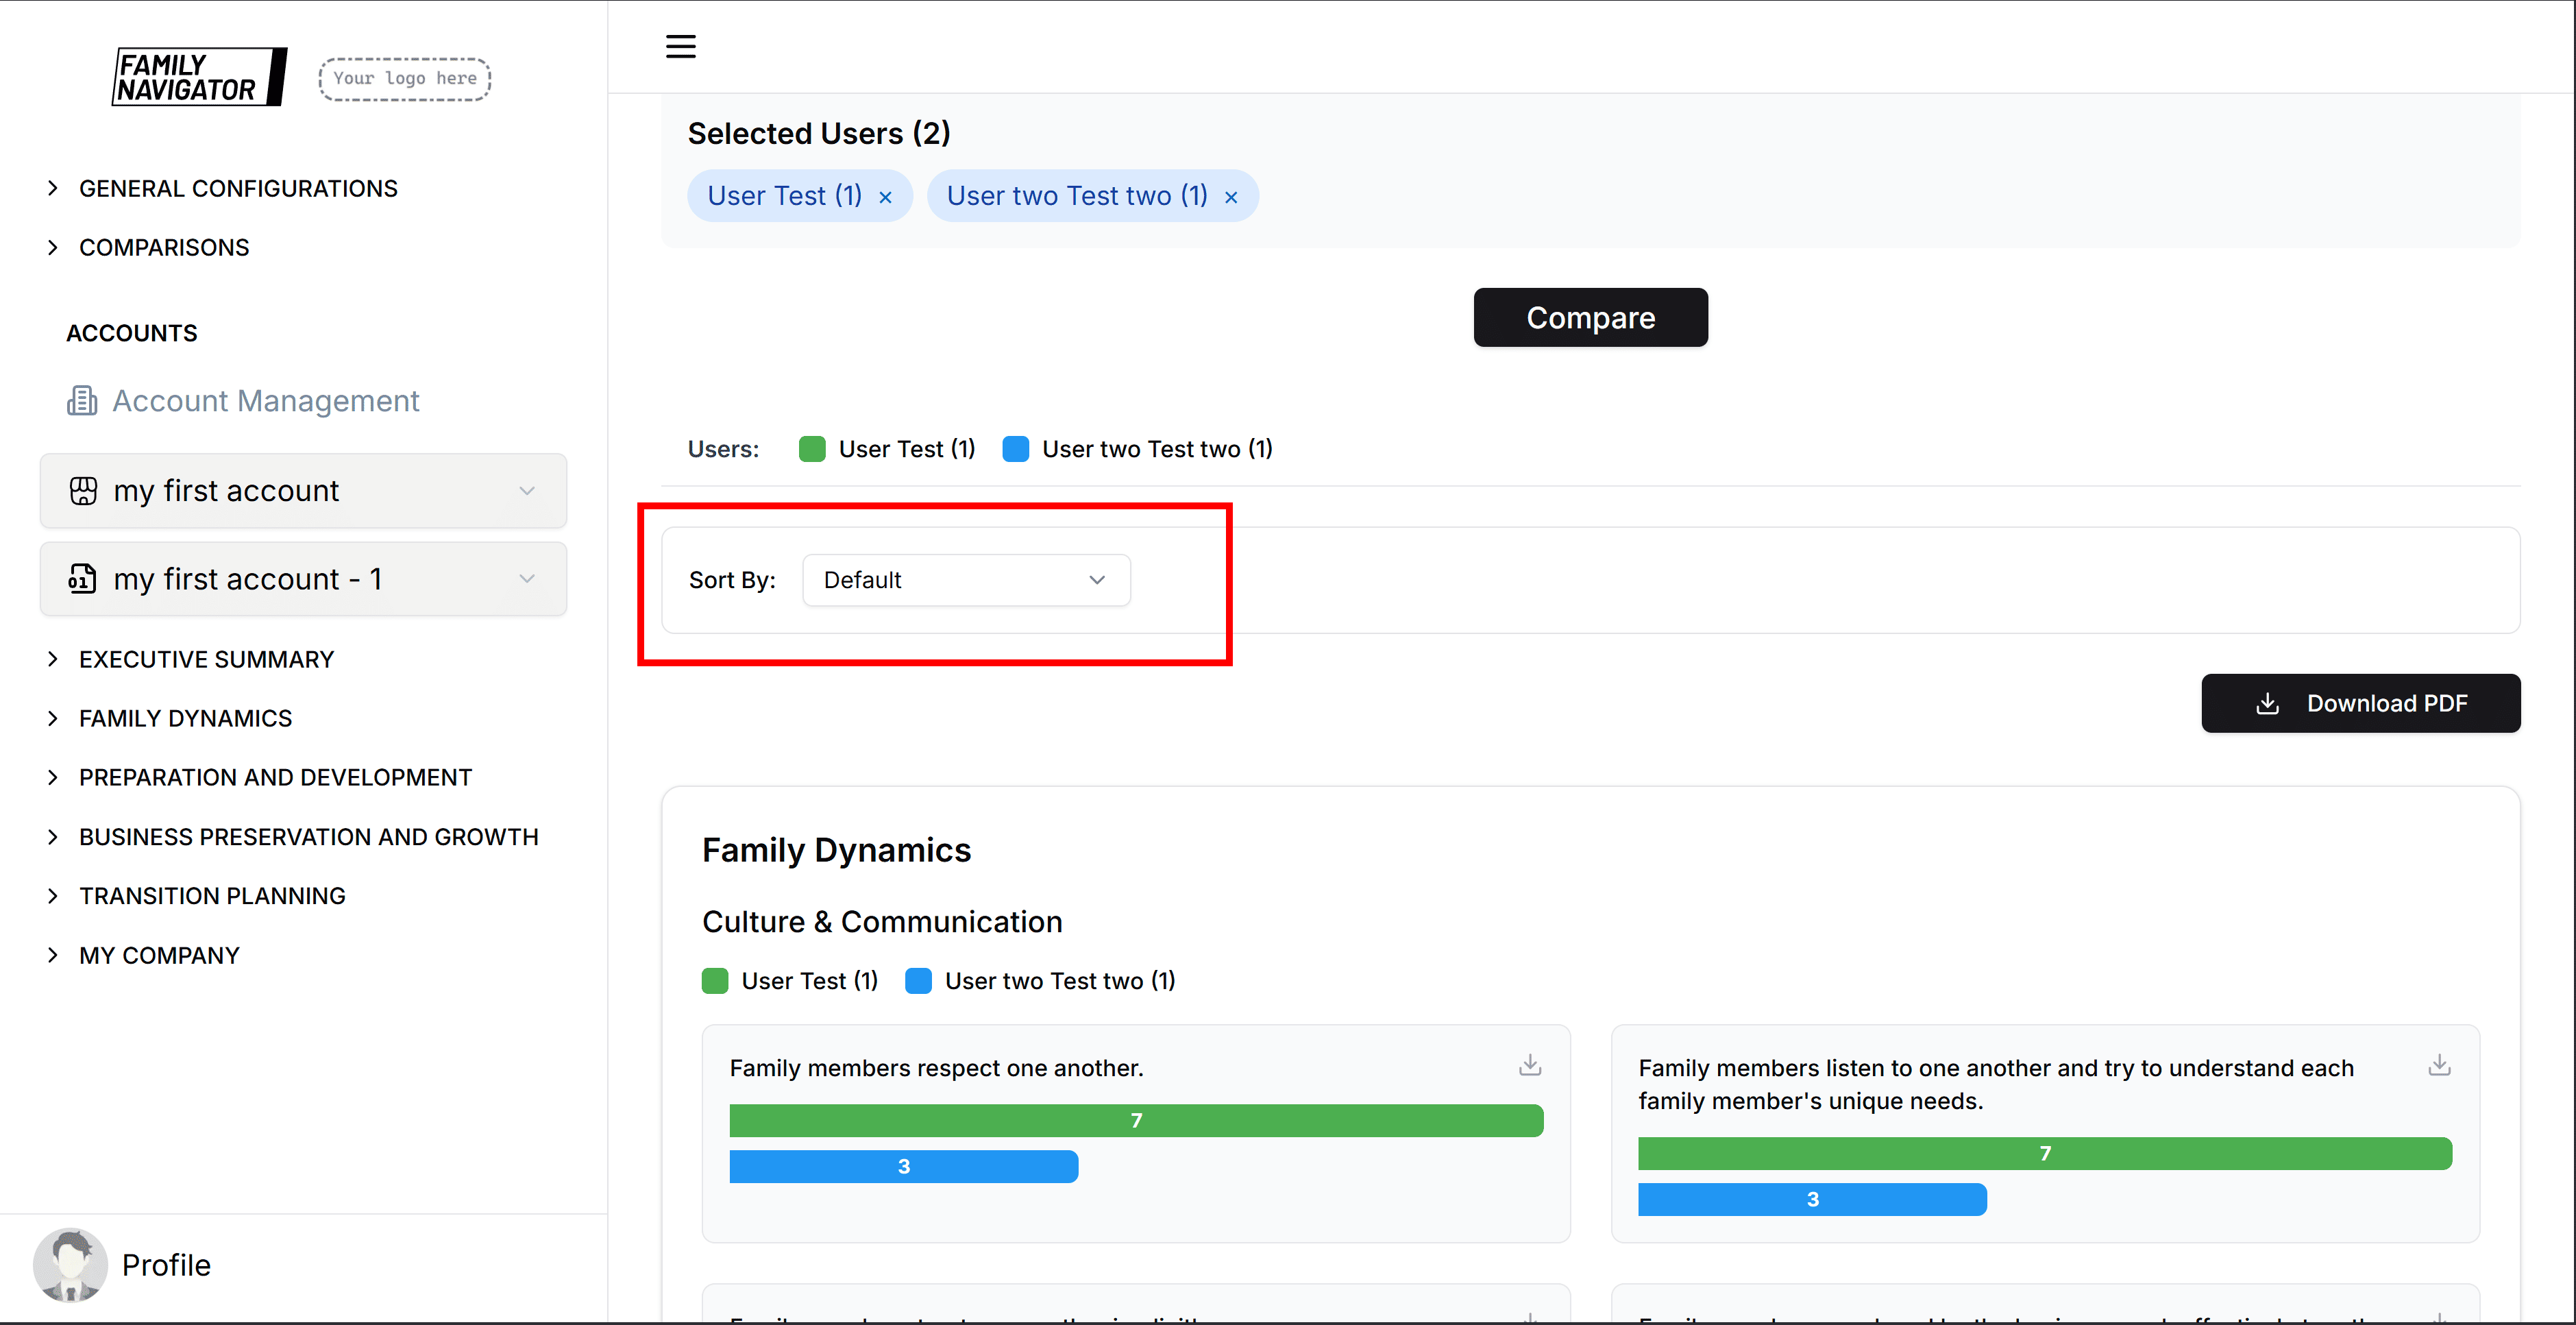
Sorting Options
Use the "Sort By" dropdown to reorder users in each question chart:
- Default: Original selection order
- Alphabetical: Sort by user name A-Z
- Ascending: Sort by response score low to high
- Descending: Sort by response score high to low
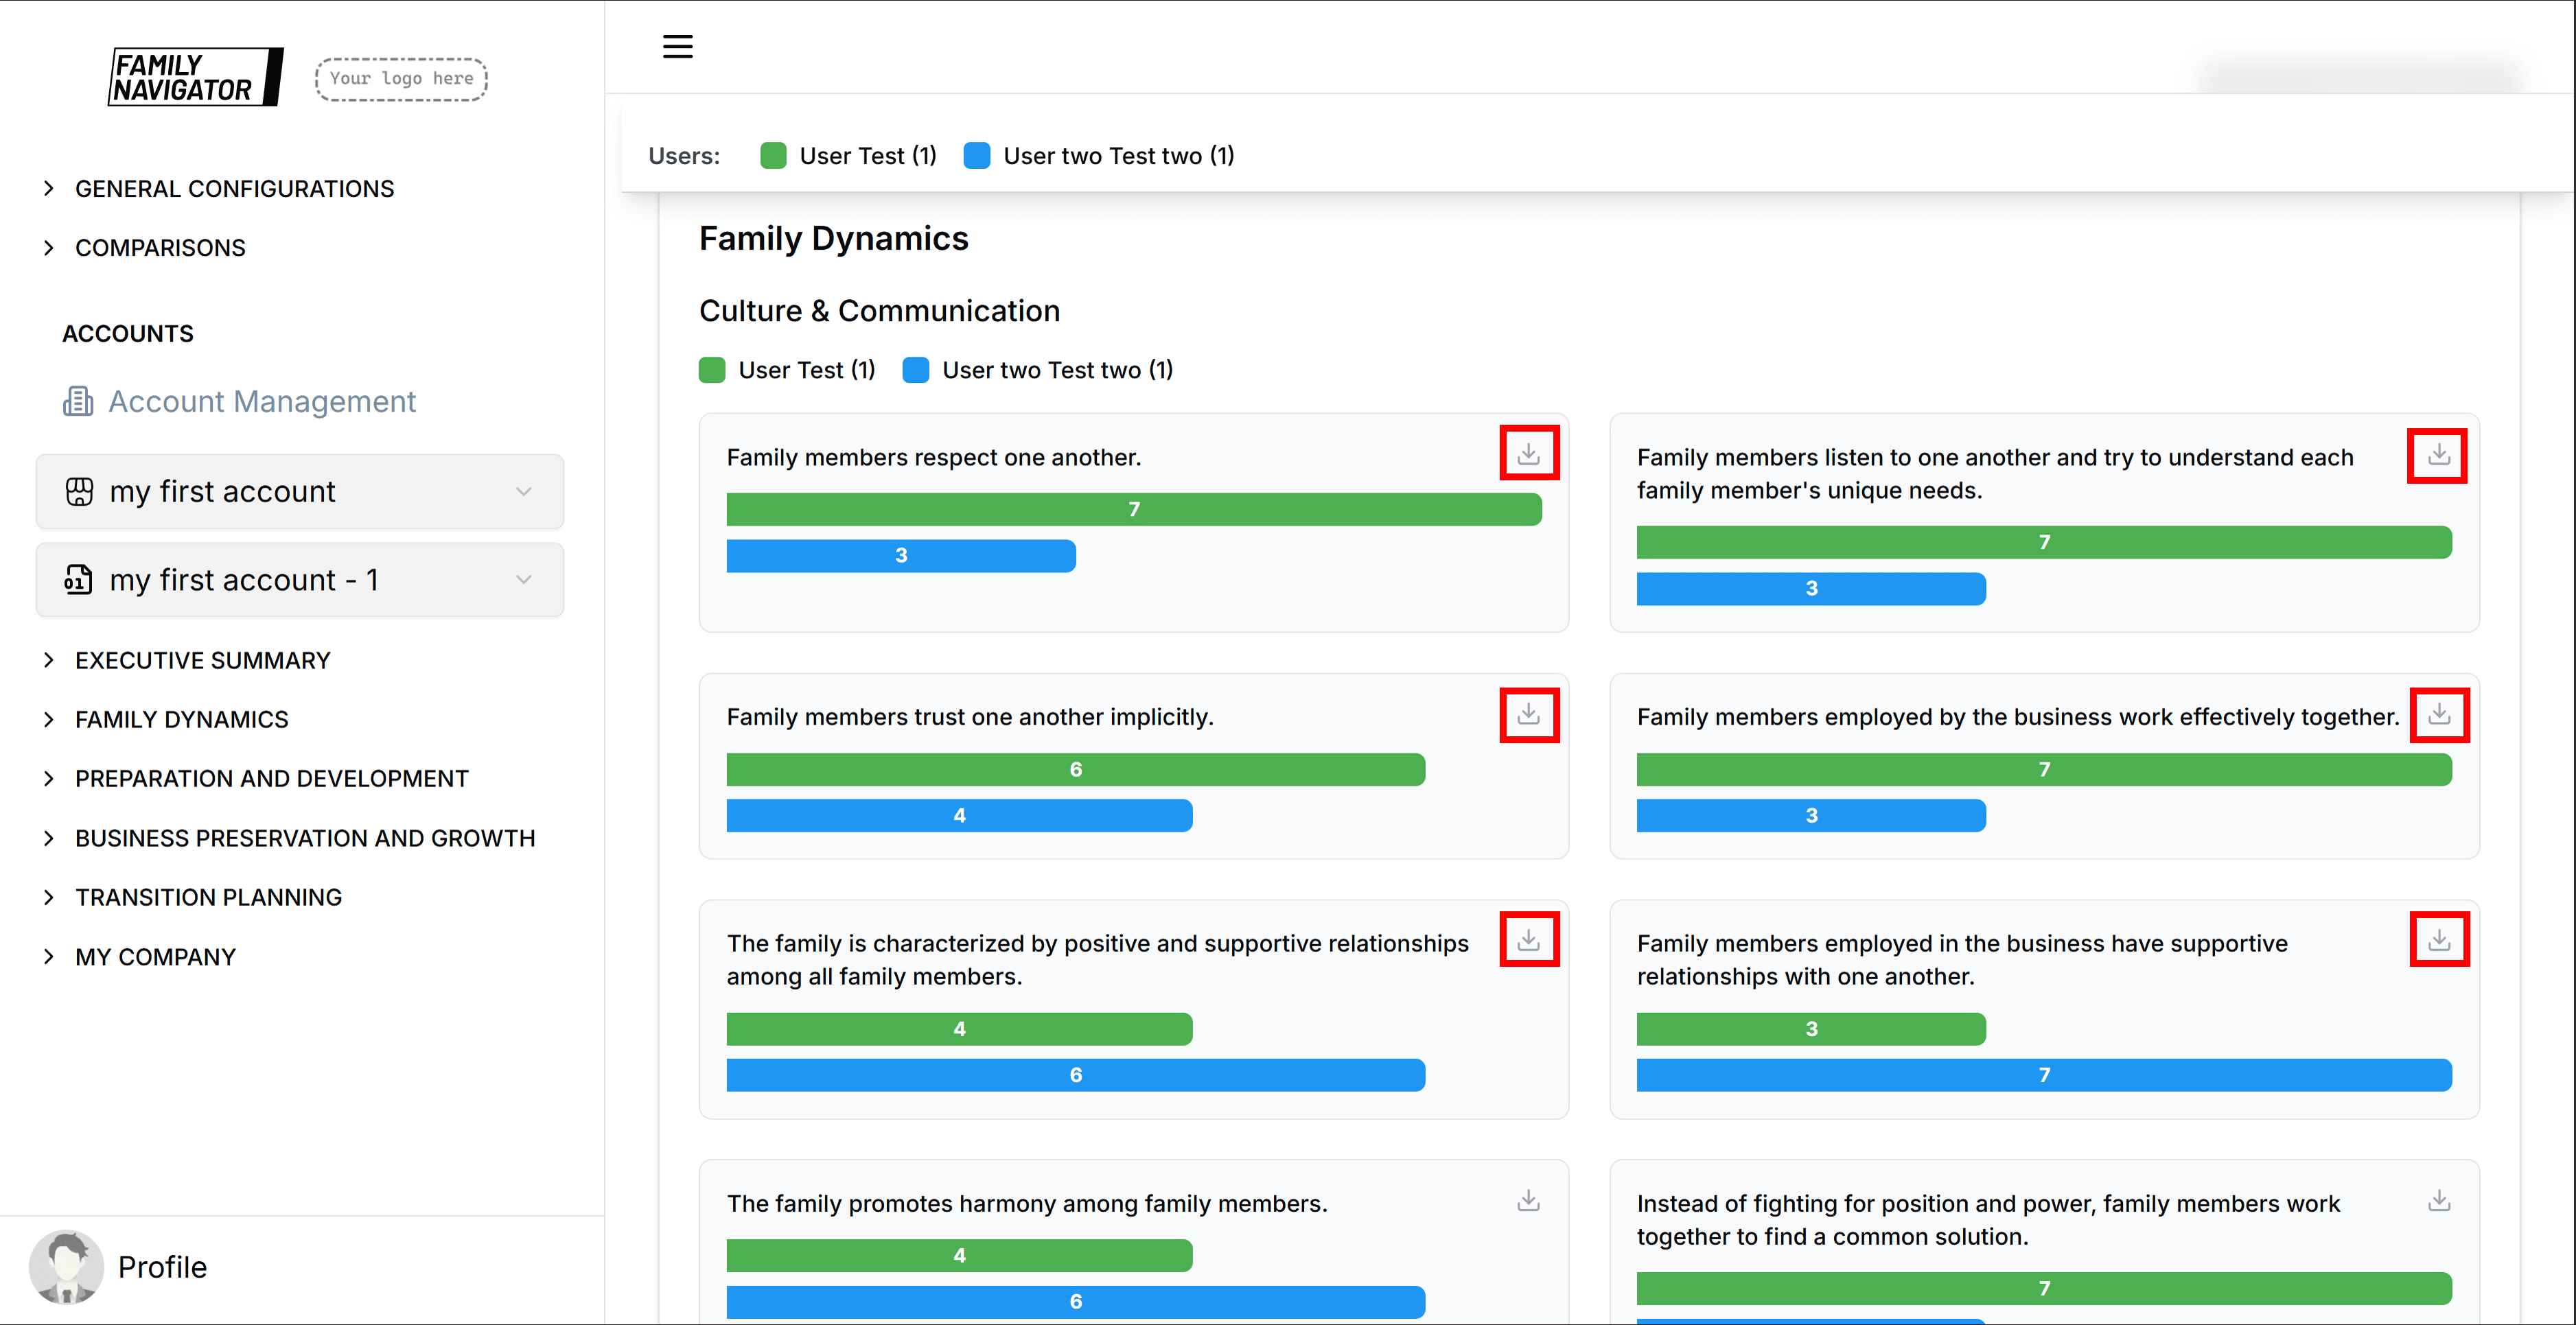
Downloading Results
Individual Question Downloads
Click the download icon next to any question to save that specific chart as an image.
PDF Report Generation
Click "Download PDF" to generate a comprehensive report with anonymization options.
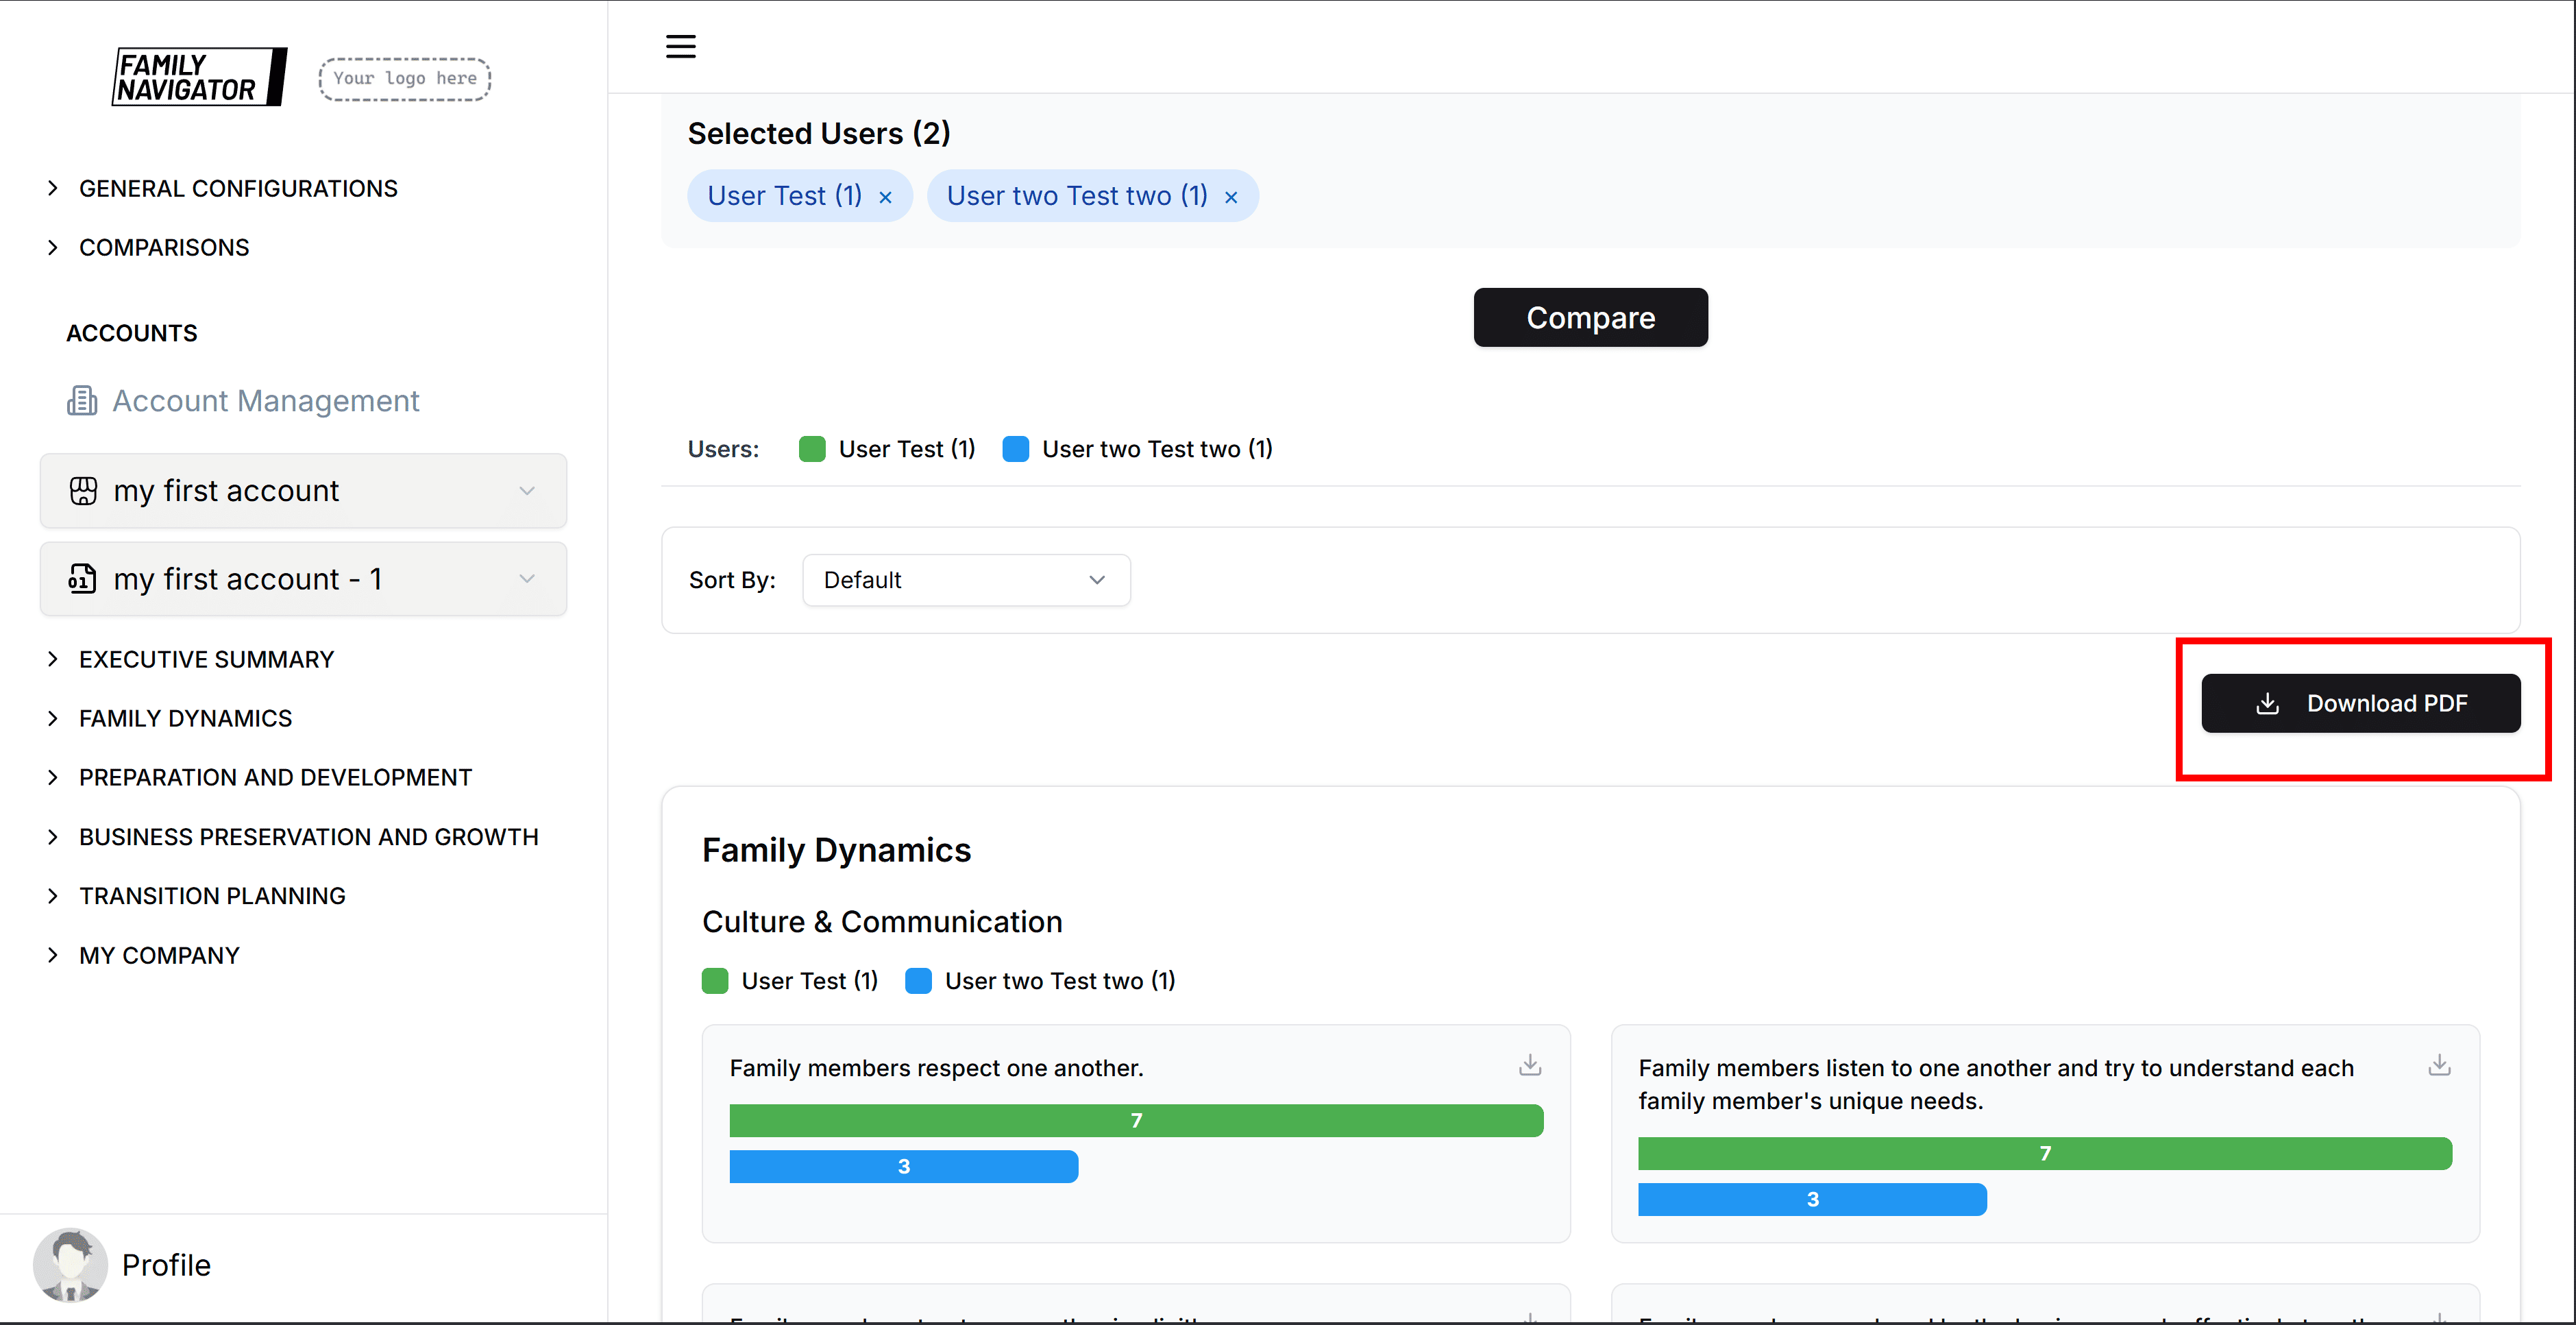
Anonymization Options
Choose what information to anonymize in the PDF:
- Anonymous names: Replace user names with generic labels
- Anonymous constituencies: Hide constituency information
- Anonymous accounts: Remove account/version details
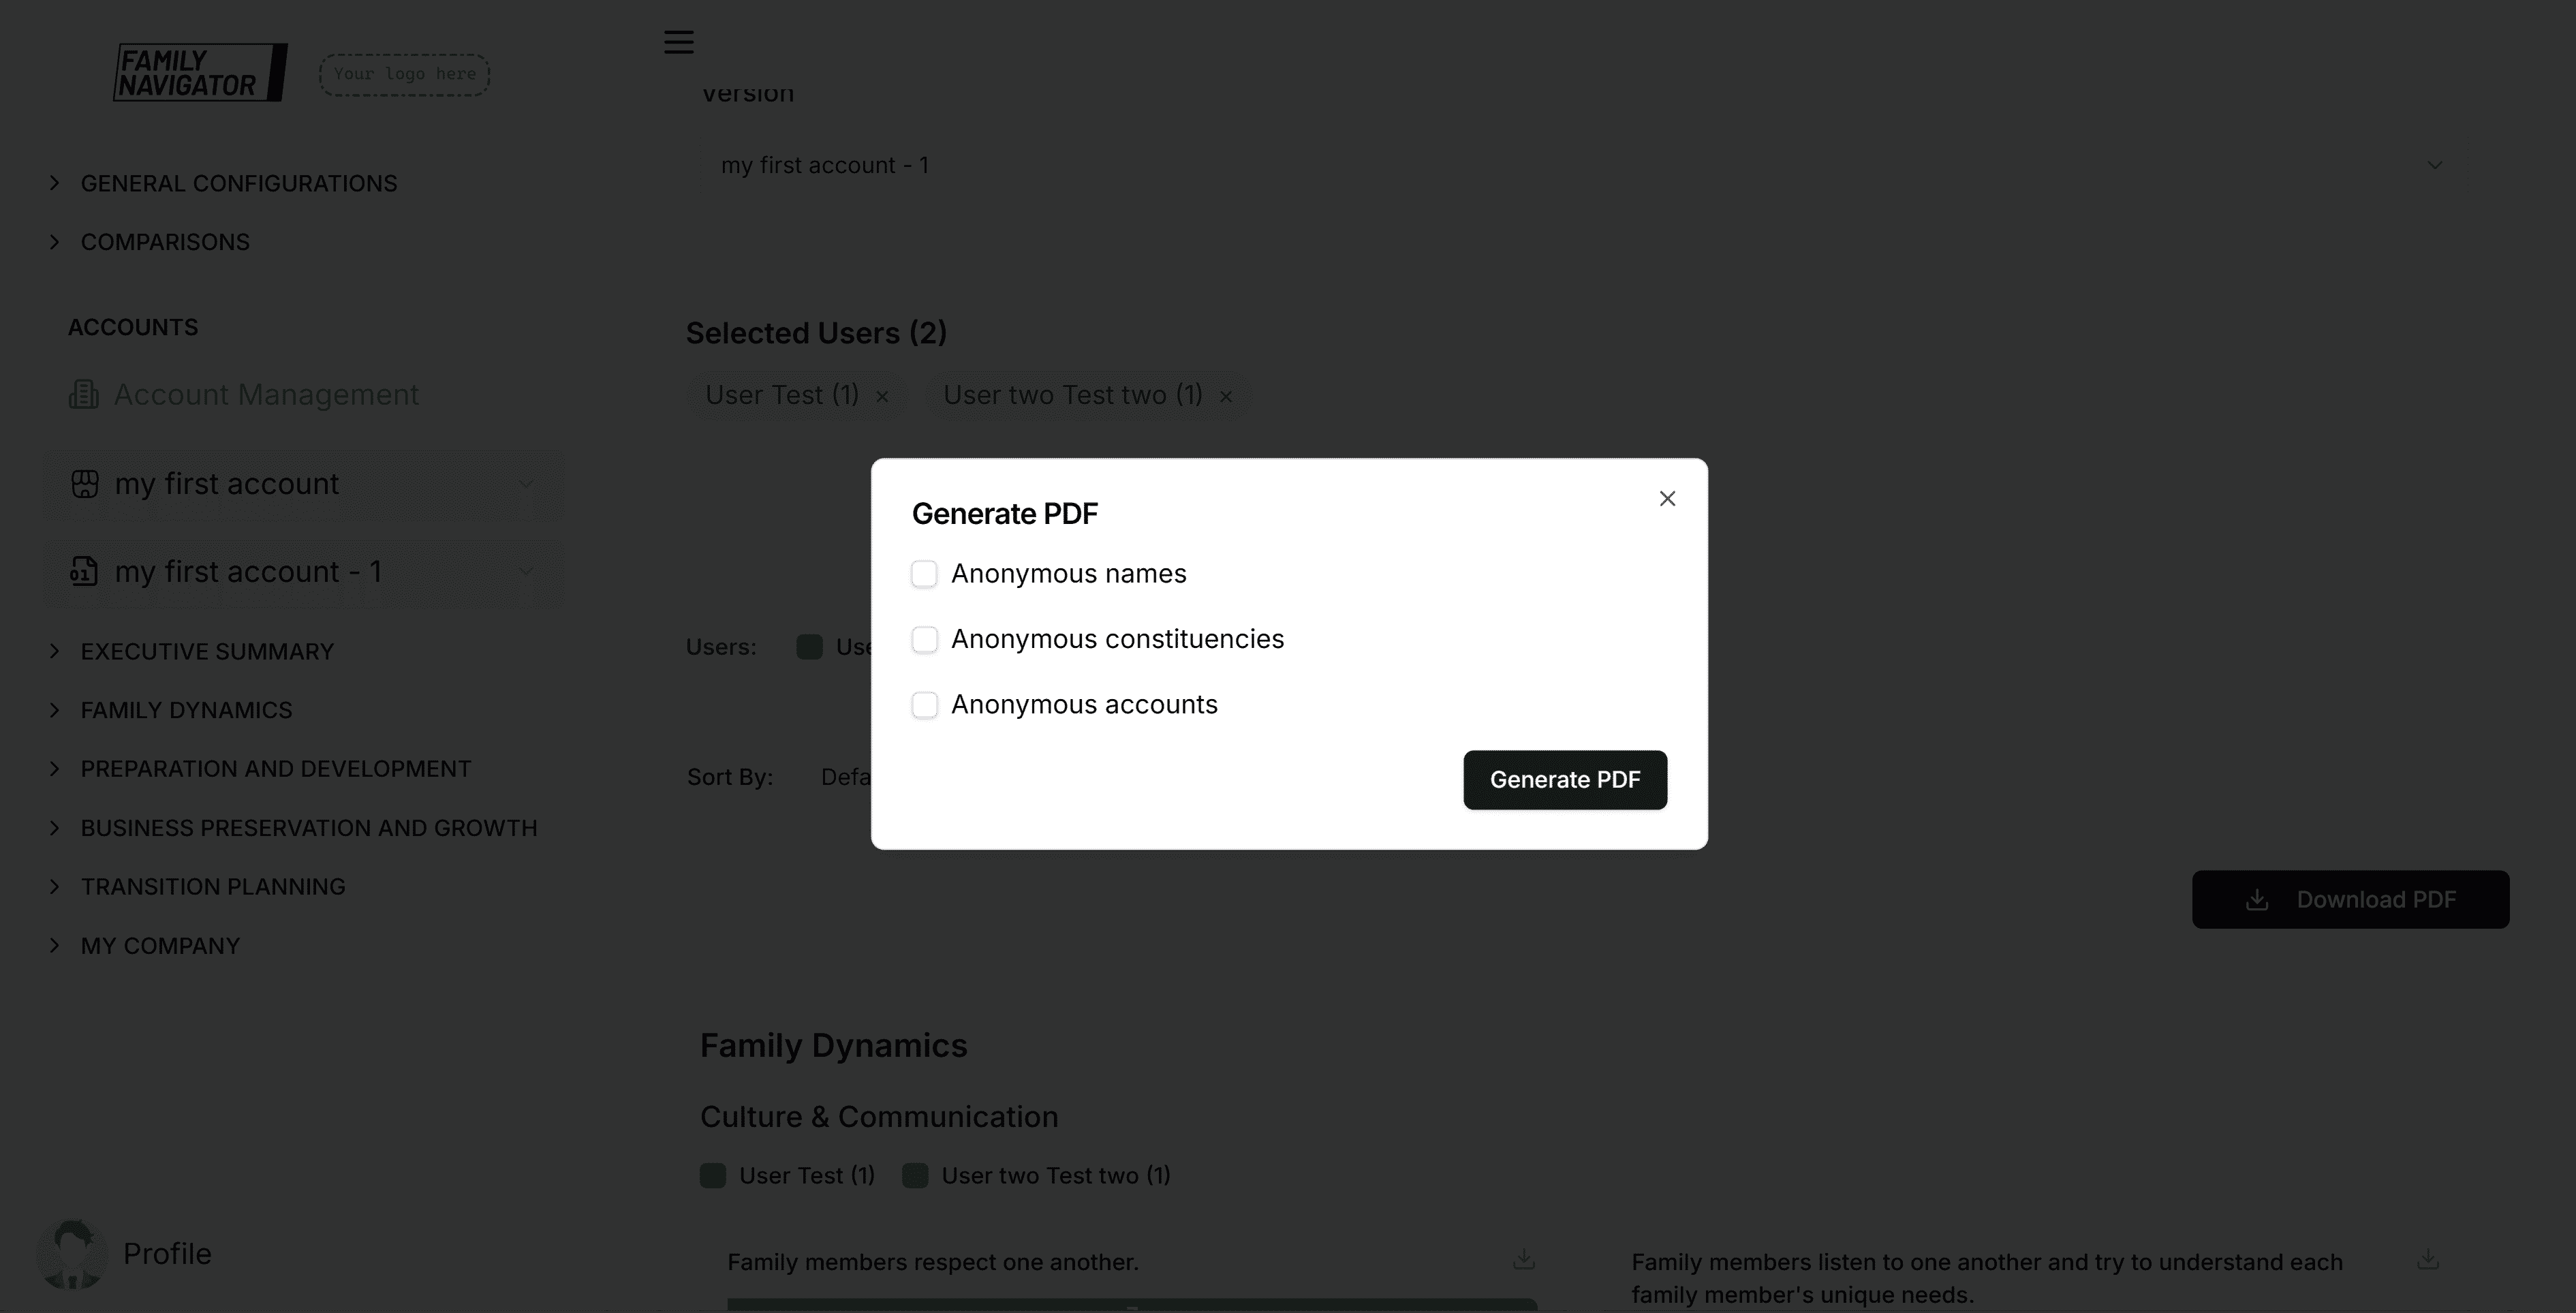
Click "Generate PDF" to create and download the report.
Error Handling
Comparison Errors
If comparison data fails to load, error messages will be displayed.
Minimum User Requirement
The compare button remains disabled until at least 2 users are selected.
Performance Considerations
- Large numbers of users may take longer to process
- Consider limiting to 5-8 users for optimal performance
- PDF generation includes all selected data
Best Practices
User Selection
- Choose users with completed questionnaires for meaningful comparisons
- Select users from similar contexts for relevant insights
- Limit to 3-6 users for readability
Data Analysis
- Use sorting options to identify patterns and outliers
- Pay attention to color coding for user identification
- Compare responses across related questions
Report Generation
- Use anonymization options when sharing sensitive information
- Download individual charts for focused presentations
- Consider audience needs when choosing download formats
Troubleshooting
- No users in dropdown: Check that account and version are selected
- Compare button disabled: Ensure at least 2 users are selected
- Charts not loading: Verify users have completed questionnaire responses
- PDF download failing: Try with fewer anonymization options
- Slow performance: Reduce number of selected users